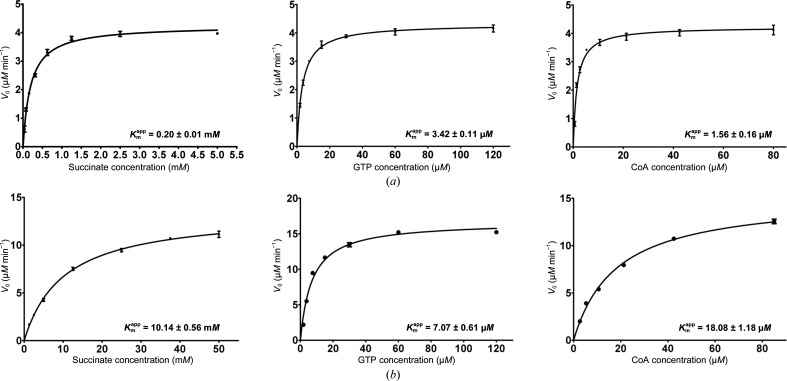
Figure 5.
Kinetic analysis of wild-type GTPSCS (a) and the E105αQ mutant (b). Initial velocities are plotted as a function of substrate concentration. The apparent Michaelis constants for succinate, GTP and CoA (
 ) calculated using the plots are given. Each point is the mean value of three measurements of the initial velocity at a specific concentration of substrate; the bar represents the standard error of the mean. The plots were generated using GraphPad Prism (version 5 for Windows; GraphPad Software, San Diego, California, USA).

