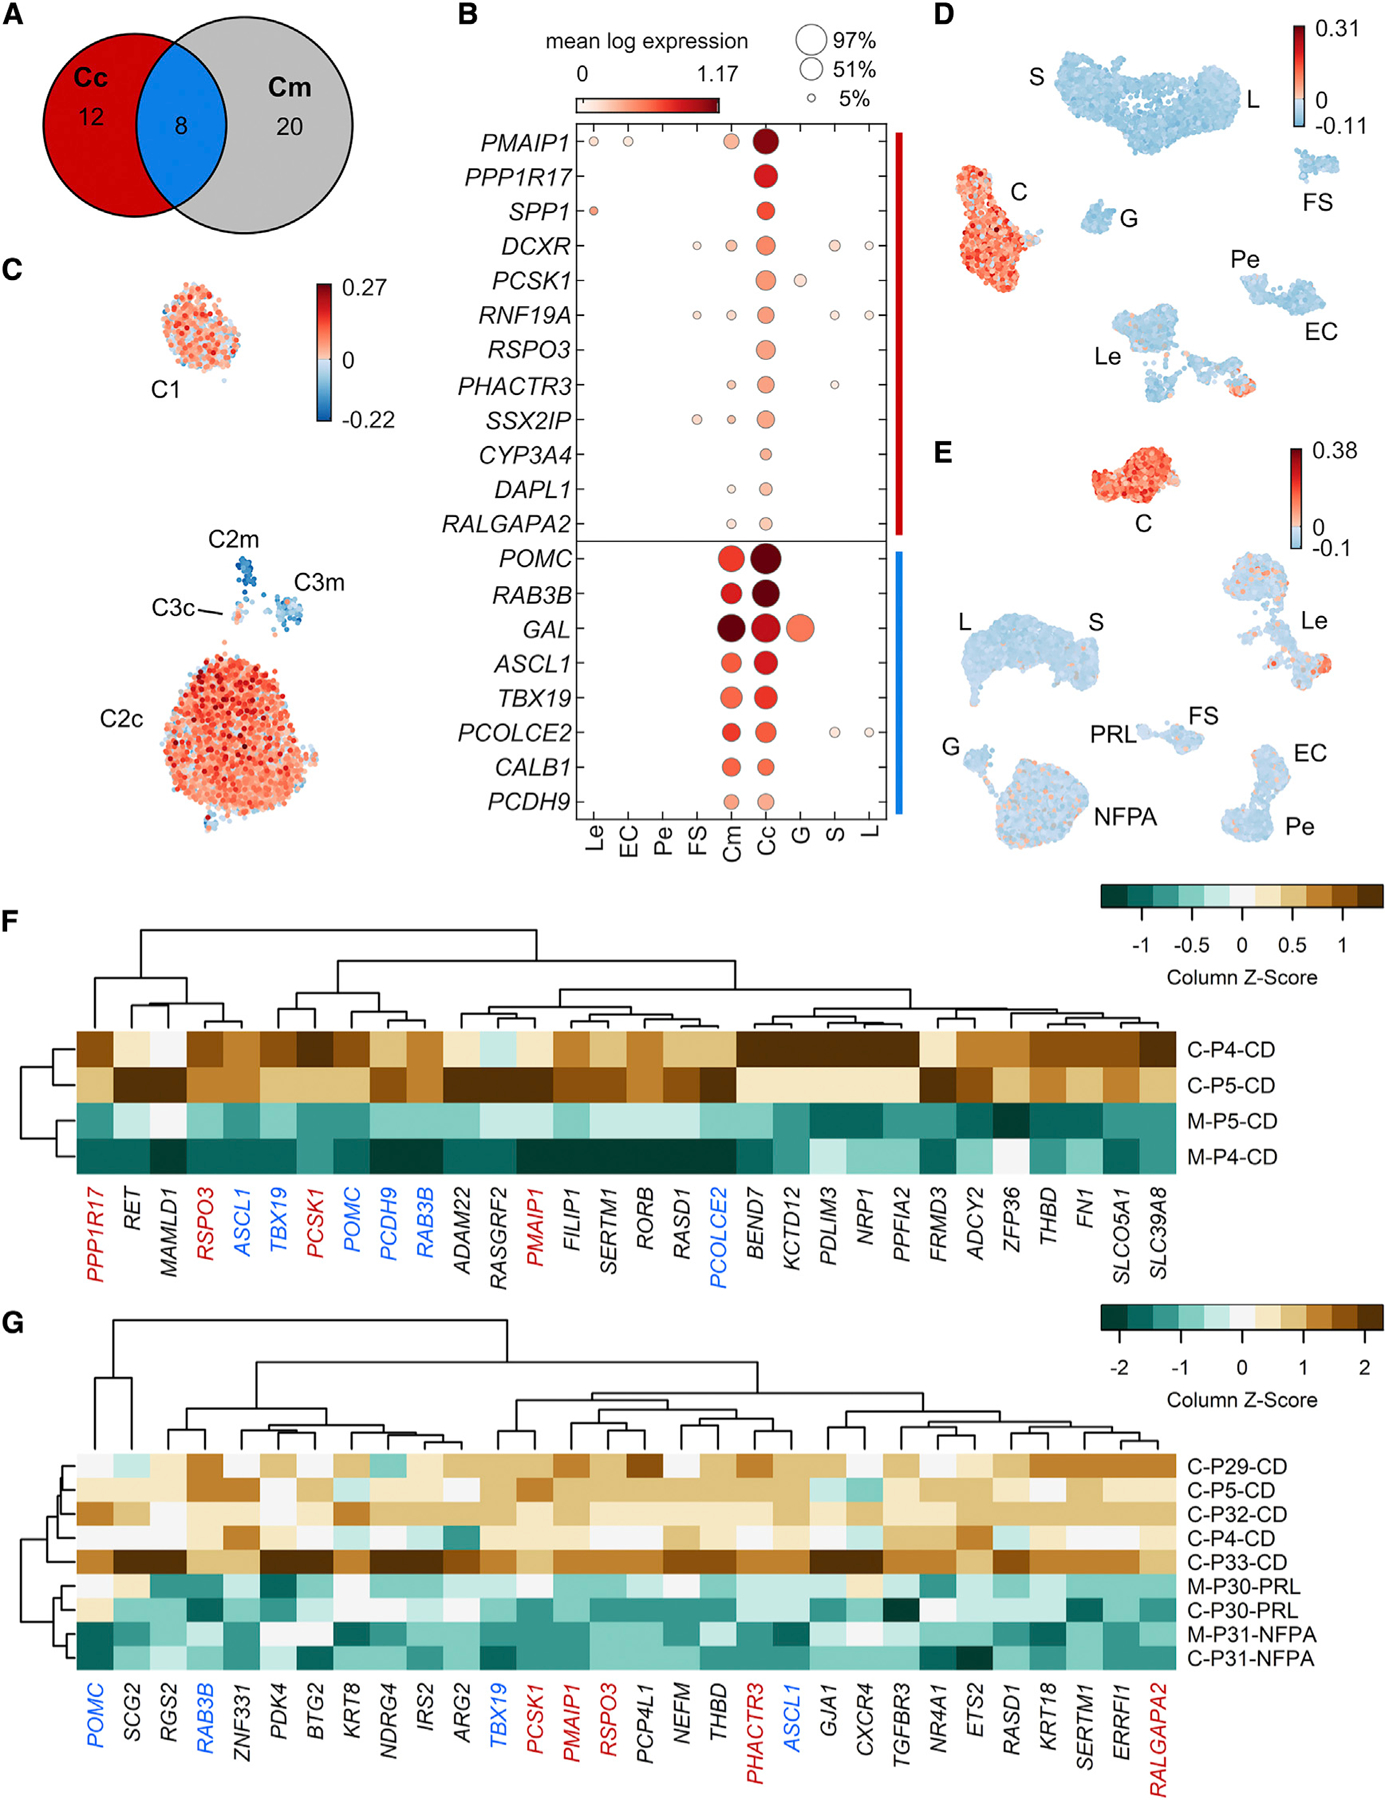
Figure 3. Consensus-dominant genes in adenomas causing CD.

Core and margin sample corticotrophs were separately compared with all other cell types with scran’s scoreMarkers, using patient identity as a blocking factor. Stringent thresholds on effect sizes were used to identify a core set of robustly upregulated markers (STAR Methods).
(A) Venn diagram showing the number of core-specific (red), margin-specific (grey), and common (blue) marker genes identified.
(B) Dot plot showing the mean expression (marker color) and percentage (marker size) of each cell type expressing core-sample-specific genes (CD signature genes; top group, red in A) and corticotroph marker genes common to core and margin samples, which include canonical marker genes (bottom group, blue in A). Mean expression values are batch corrected across patients using scran correctSummaries. POMC expression was normalized to the second most highly expressed value to better show the levels of other genes (mean POMC: 8.29).
(C) UMAP plot of all C cells indicating the CD signature gene score per cell.
(D) UMAP plots for all cells from each patient show that cells with high CD signature scores are restricted to cell clusters classified as corticotrophs.
(E) UMAP plots for other adenoma subtypes including prolactinoma (PRL) and nonfunctioning pituitary adenoma (NFPA) verify that cells with high CD signature scores are specific to Cushing’s adenomas (C).
(F) Independent verification of overexpression of CD signature genes in pairwise bulk RNA-seq analysis of CD adenoma and adjacent normal pituitary gland (P4 and P5). Genes coidentified between bulk RNA-seq and scRNA-seq are color coded as in (B).
(G) Bulk RNA-seq comparison of CD and non-CD samples also verified upregulation of several CD signature and corticotroph marker genes.
