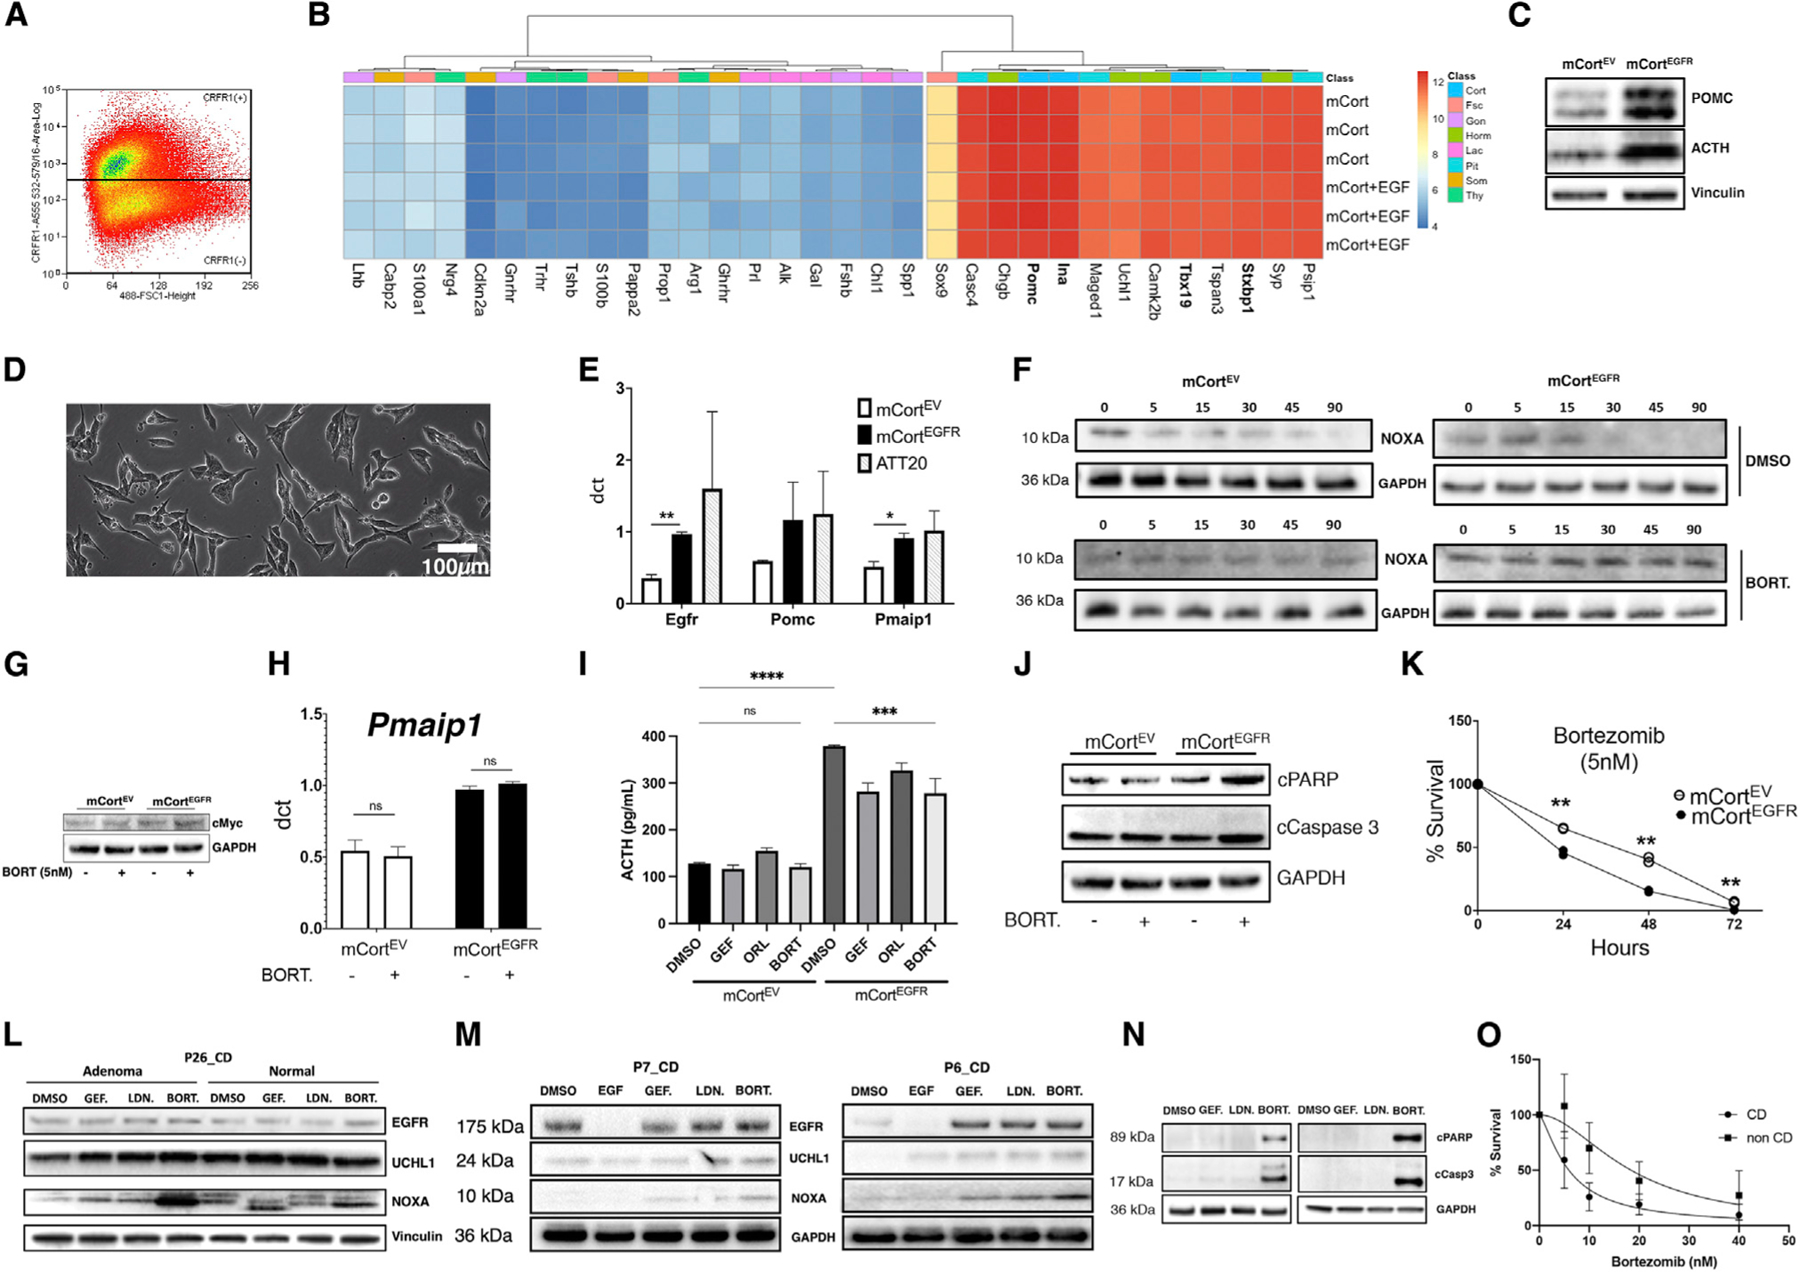
Figure 6. Proteasome inhibition rescues noxa and accelerates apoptotic cell death in wild-type CD adenomas.

(A) Mouse pituitary cells (3 biological replicates) were flow sorted and enriched for cortricotropin-releasing hormone receptor (CRFR1).
(B) The cell line enriched for corticotrophs (mCort) demonstrated markers of corticotroph differentiation using PCR arrays (3 biological replicates per cell line). Gene expression remained stable after addition of EGF.
(C) The ACTH-producing CD phenotype was recapitulated following lentiviral human EGFR transduction (mCortEGFR) with increased POMC processing to ACTH (n = 3).
(D) Representative bright-field image showing mCort cells with elongated processes and abundant intracellular organelles.
(E) The tumorigenic sequence of CD adenomas was recapitulated with relative overexpression (qRT-PCR; ΔCT; GAPDH) of both POMC and PMAIP1 (2 experiments in technical triplicates) following lentiviral human EGFR transduction (mCortEGFR). *p < 0.05.
(F) Cycloheximide chase study (2 experiments) in murine mCort cells demonstrated post-translational degradation of noxa that was arrested with proteasome inhibitor bortezomib (5 nM, BORT.).
(G) Bortezomib (5 nM) decreased MYC protein levels in mCortEGFR but not in mCortEV cells (2 independent experiments).
(H) Bortezomib (5 nM) induced minimal transcriptional upregulation of PMAIP1 in mCort cells, suggesting a predominantly post-translational effect (3 independent experiments in technical triplicates).
(I) Supernatant from mCortEGFR cultures showed elevated ACTH production with EGFR overexpression recapitulating the adenoma phenotype (ACTH oversecretion; 3 independent experiments in technical triplicates). Additionally, bortezomib exposure reduced ACTH in supernatant from mCortEGFR cells. *p < 0.05.
(J) Bortezomib resulted in elevated cleaved PARP (cPARP) and cleaved caspase-3 (cCaspase3) in mCortEGFR cells following exposure to bortezomib (5 nM, 6 h; 2 replicates).
(K) Bortezomib exposure for 24 h decreased survival in mCortEGFR cells at lower bortezomib concentrations (IC50: 1.5 nM) compared with in mCortEV cells (IC50: 3.096 nM). **p = 0.0087, 0.0066, and 0.0080 for 24, 48, and 72 h, respectively. Data shown for dose response performed on each cell line in triplicate and timed survival in duplicate. *p < 0.05.
(L–N) Biological duplicates.
(L) Pairwise analysis of adenoma and normal cells from a patient with CD (P26_CD). Responses to DMSO control versus EGFR inhibitor gefitinib (GEF), UCHL-1 inhibitor LDN-57444 (LDN), or proteasomal inhibitor bortezomib (BORT). Protein levels of EGFR; DMSO, dimethyl sulfoxide; EGFR, epidermal growth factor receptor; UCHL-1, ubiquitin C-terminal hydrolase L1.
(M) Patient-derived CD adenoma primary cell lines P7 and P6 demonstrated elevated EGFR expression at baseline that was suppressed with EGF (100 ng, 24 h) exposure. Bortezomib (5 nM, 6 h) induced noxa at a higher level than gefitinib (10 μM, 6 h) or UCHL1 inhibitor LDN (15 μM, 6 h).
(N) Bortezomib induced markers of apoptosis with cPARP and cCaspase3 in human-derived primary CD adenoma cells.
(O) Bortezomib (24 h) decreased cumulative survival in human-derived primary cell lines from CD (n = 5; IC50: 5.929 nM) and non-CD (n = 3; IC50: 18.42 nM) cell lines (p < 0.0001); data shown in triplicates.
