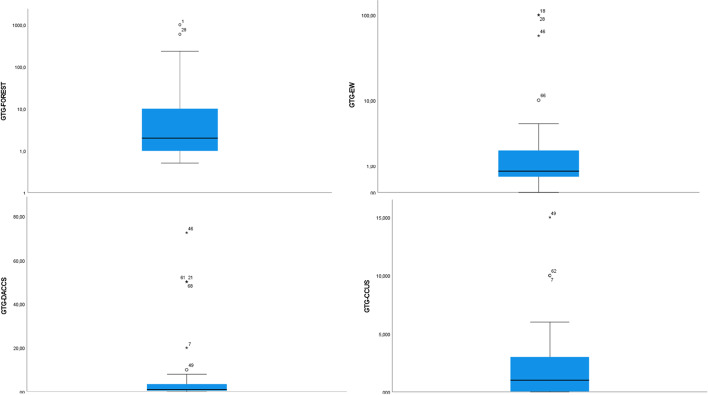
Fig. 3.
Expert perceptions on the greenhouse-gas-reduction potential of negative-emissions technologies.
Source: Authors (N = 47 respondents). The figure shows the results (on a logarithmic scale, to include all outliers) for the question “Another way of prioritizing options is to quantify them. By the year 2050, how many gigatons of carbon dioxide equivalent do you expect each of the following options to reduce, displace, or avoid?” Illustrative results are shown for afforestation and reforestation, enhanced weathering, direct air capture, and carbon capture utilization and storage. The bars within the boxes refer to the median. As with our other questions, this one required our experts to judge for themselves expectations about future quantification. The answer depends entirely on how much the expert thinks this will be deployed, which may depend heavily on policies and goals, or other assumptions. The full data tables behind this figure are presented in Appendix 3

