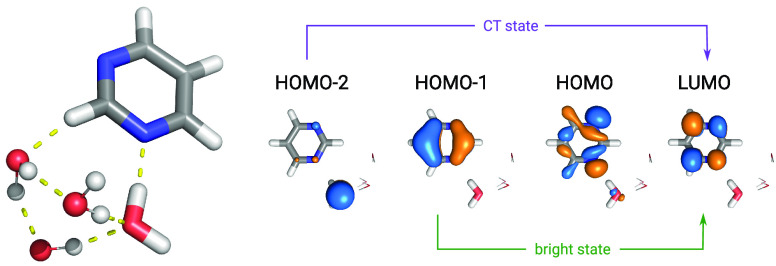
Figure 2.
Graphical representation of the clusters Pm(H2O)4 (left); hydrogen bonding is represented with dashed yellow lines, molecules in the MM region are represented with balls and sticks, while those in the QM region are represented as licorice. Relevant transitions for the EDPT process represented as single excitations between molecular orbitals at the equilibrium geometry of Pm(H2O)4. MOs are computed with QM/AMOEBA Hamiltonian and plotted as isosurfaces at +0.01 and −0.01 in orange and blue, respectively.

