
Figure 2.
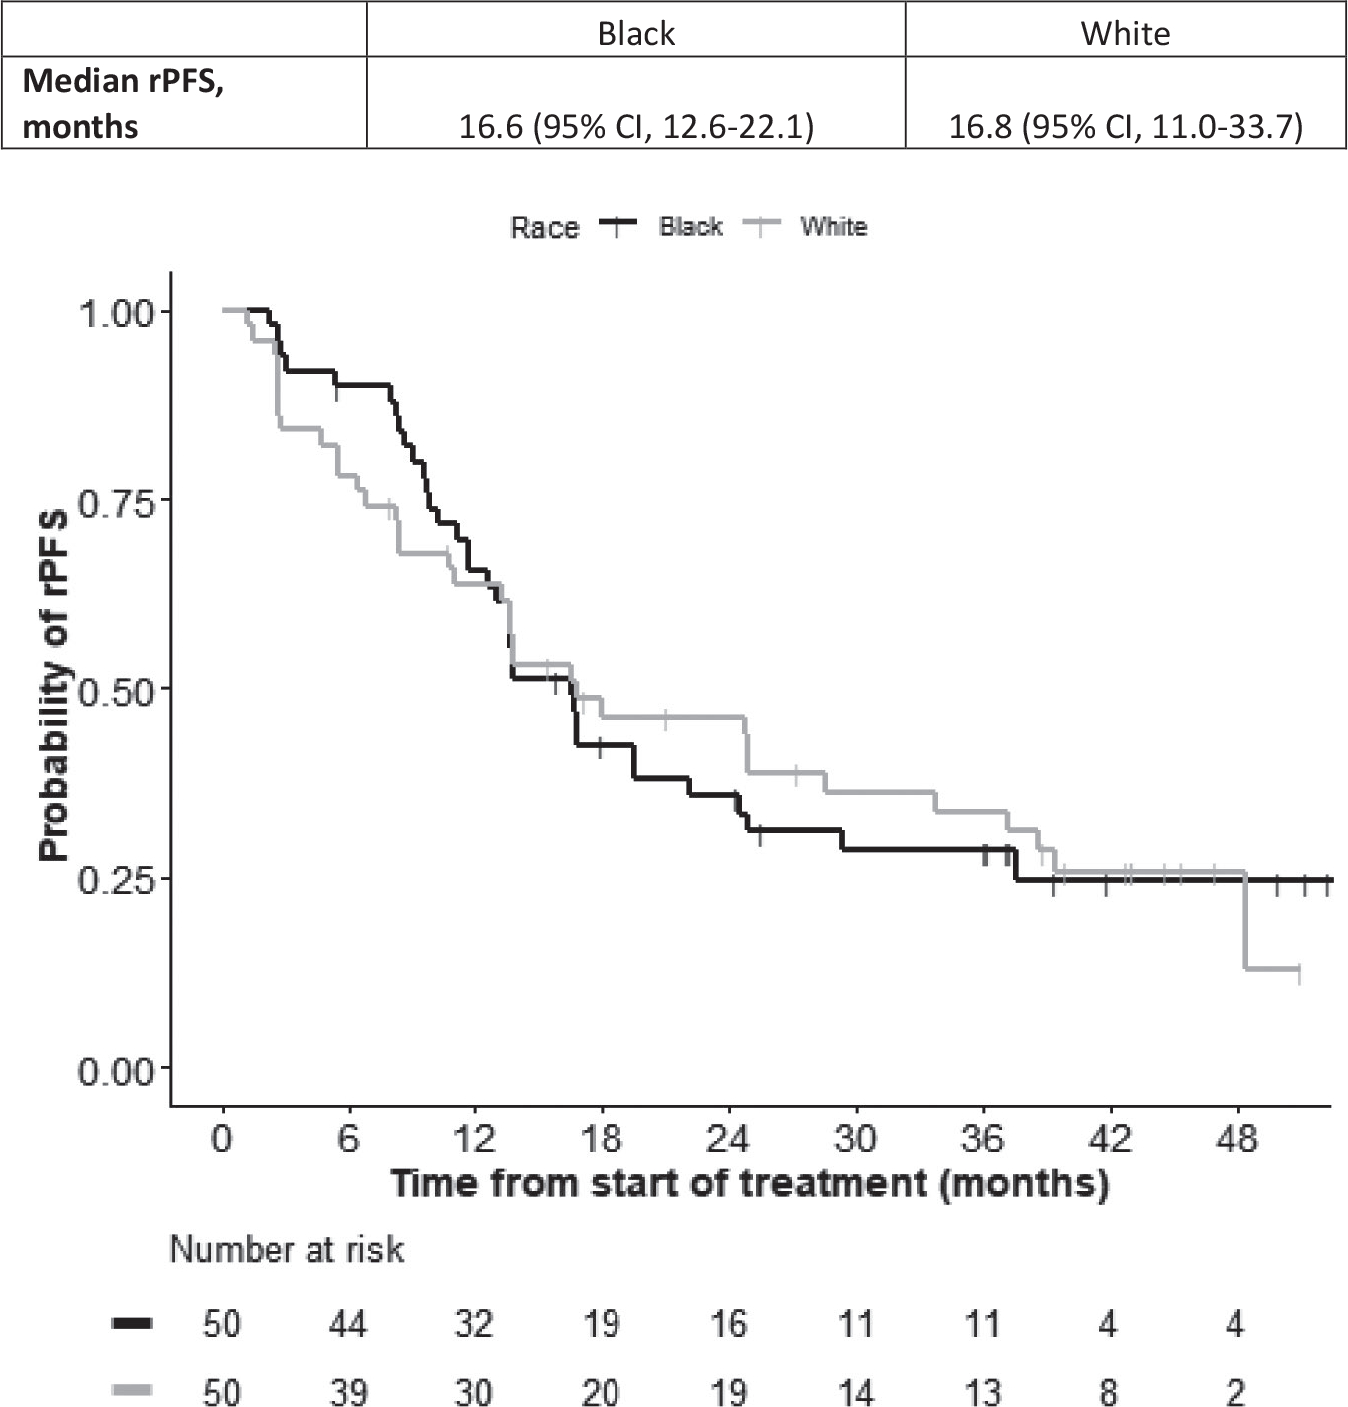
Kaplan-Meier curves illustrate radiographic progression-free survival (rPFS) in Black patients (black curve) and White patients (gray curve). Median rPFS estimates are shown with 95% CIs. This graph is for illustrative purposes only; the study was not powered for cohort comparisons. Any comparison is for hypothesis generation only.