
Figure 4.
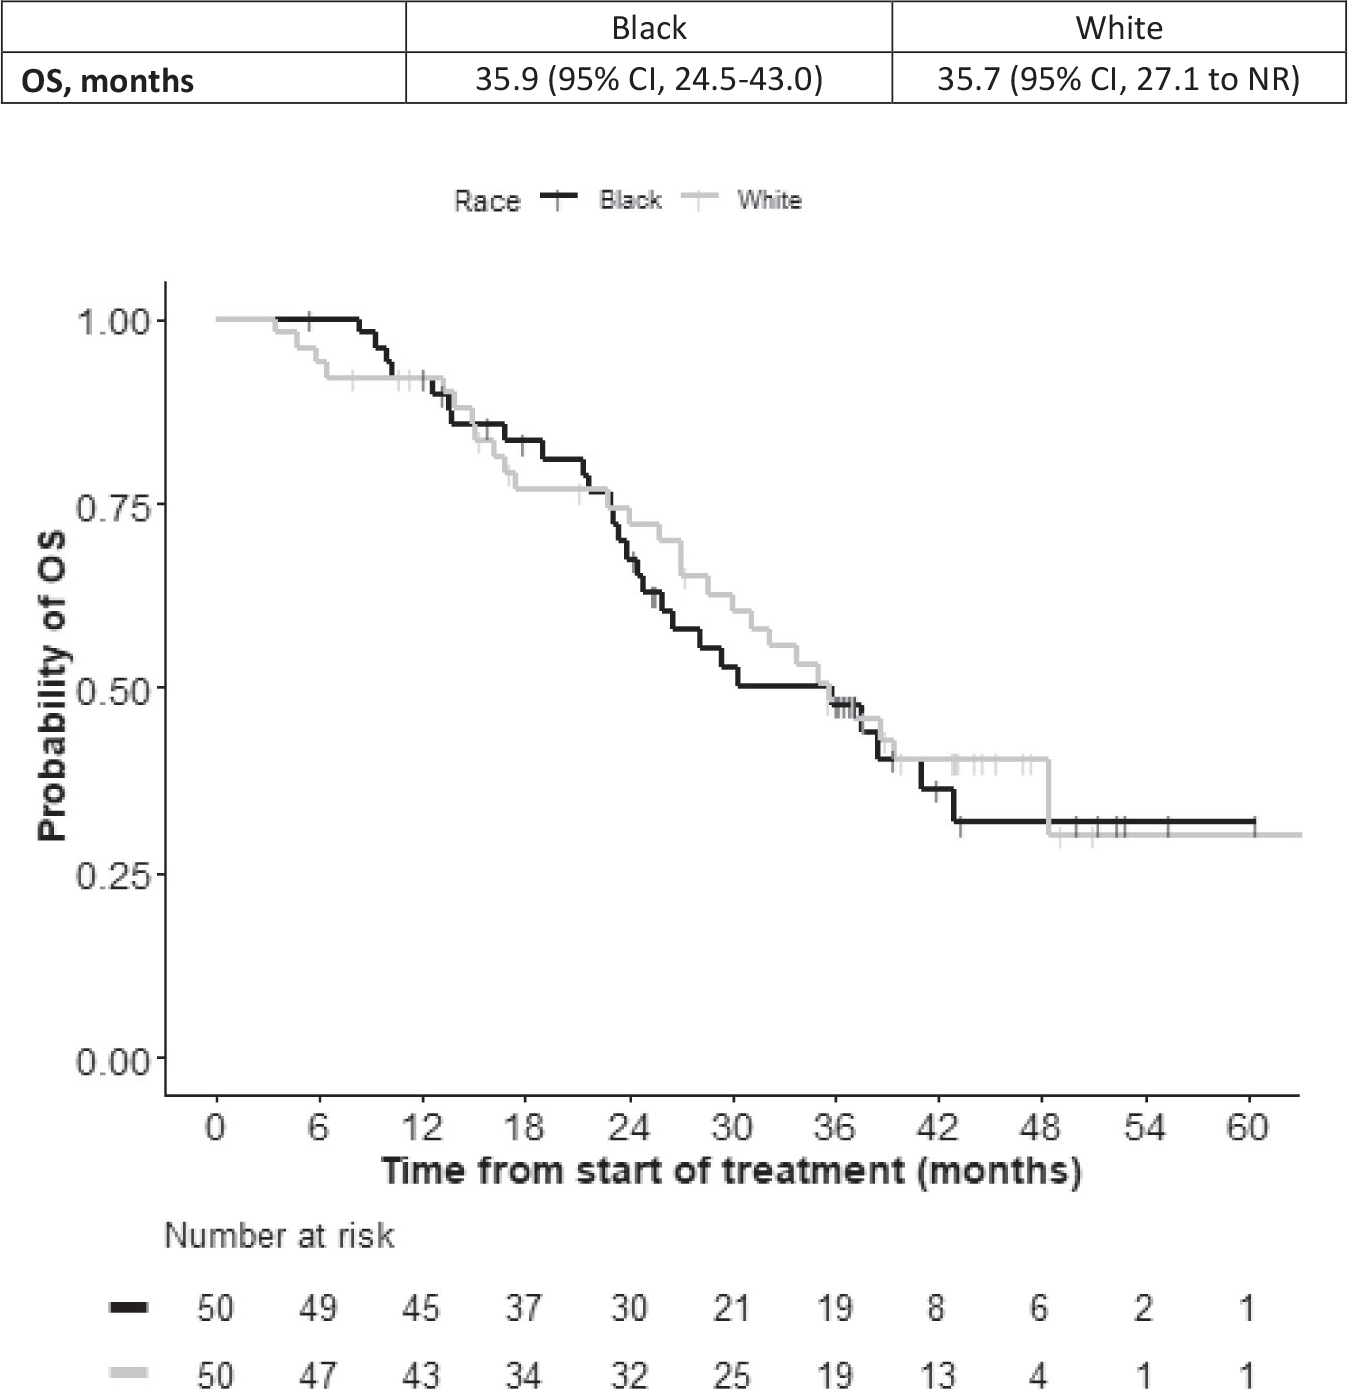
Kaplan-Meier curves illustrate overall survival (OS) in Black patients (black curve) and White patients (gray curve) who had metastatic, castrate-resistant prostate cancer and received treatment with abiraterone acetate plus prednisone. Median OS estimates are shown with 95% CIs. The graph is for illustrative purposes only; the study was not powered for cohort comparisons. Any comparison is for hypothesis generation only. NR indicates not reached.