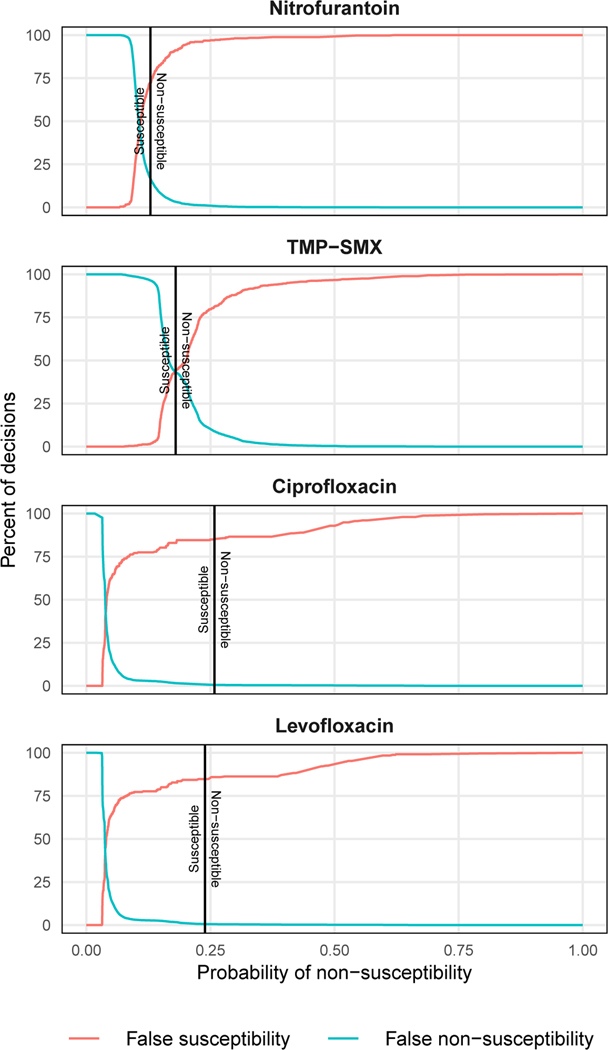
Figure 3: False susceptibility and non-susceptibility rates.
Rates of false susceptibility and false non-susceptibility for prediction models derived from the training data. Final thresholds used on the test data are indicated by a black vertical line. Isolates with probabilities of susceptibility below the threshold were categorized as susceptible and those above were categorized as non-susceptible.

