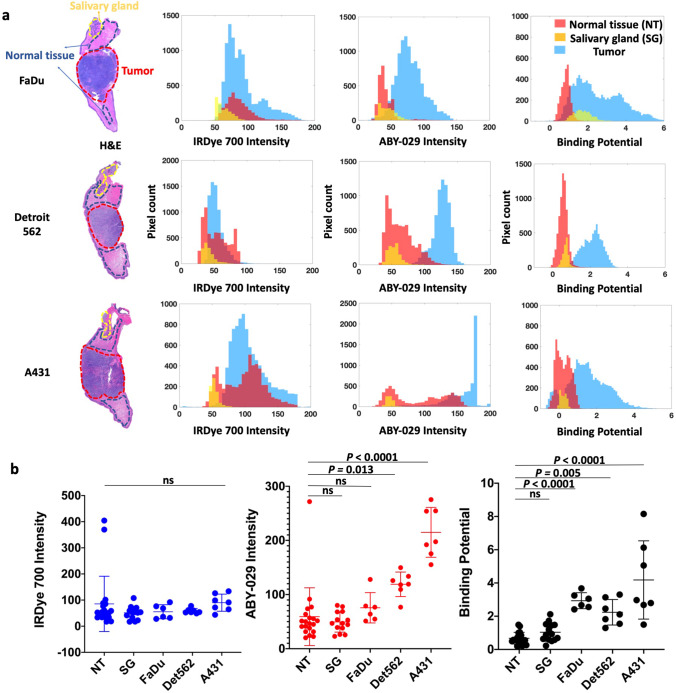
Fig. 2.
Tumor and normal tissue discrimination by signal intensity. a After image co-registration, pathologist-defined ROIs of normal tongue (NT), salivary glands (SG), and tumor were drawn on the gold standard H&E images. Signal intensity in the ROIs on corresponding untargeted fluorescence, targeted fluorescence, and BP images are compared for a representative tumor from each cell line. b The average signal from each ROI was plotted for all animals in three tumor groups. For clarity, only the statistical mean comparison with normal tissue is shown.

