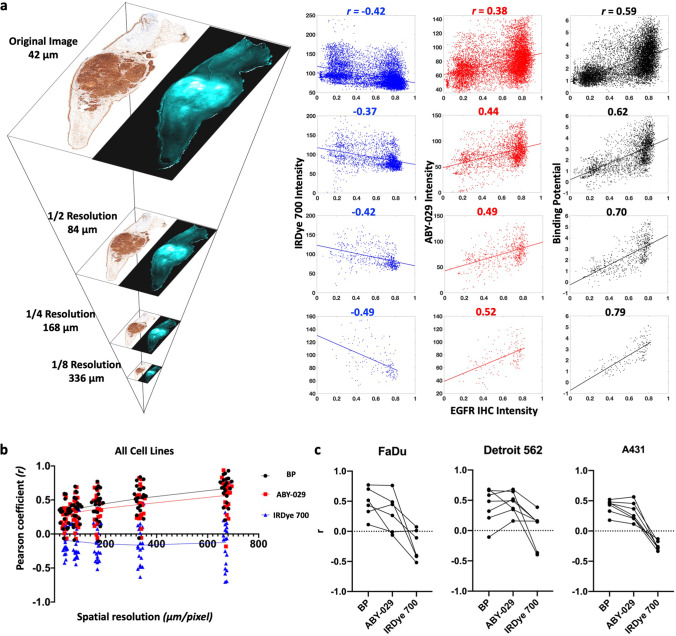
Fig. 4.
BP and fluorescence images were correlated to EGFR IHC on a pixel-to-pixel basis using the Pearson correlation coefficient (r). EGFR expression heterogeneity is most accurately represented by PAI determined BP. a Pixel resolution was reduced to the clinically relevant range by the image pyramid method. BP and fluorescence against IHC intensity were plotted for representative images at four image resolutions. b The r from all specimen were plotted against spatial resolution, which indicates a steady increased correlation to IHC for BP and ABY-029. c Pearson’s correlation coefficients of BP, ABY-029, and IRDye 700 with IHC at 168-μm image resolution were presented in three panels, with each line representing data from individual mouse.

