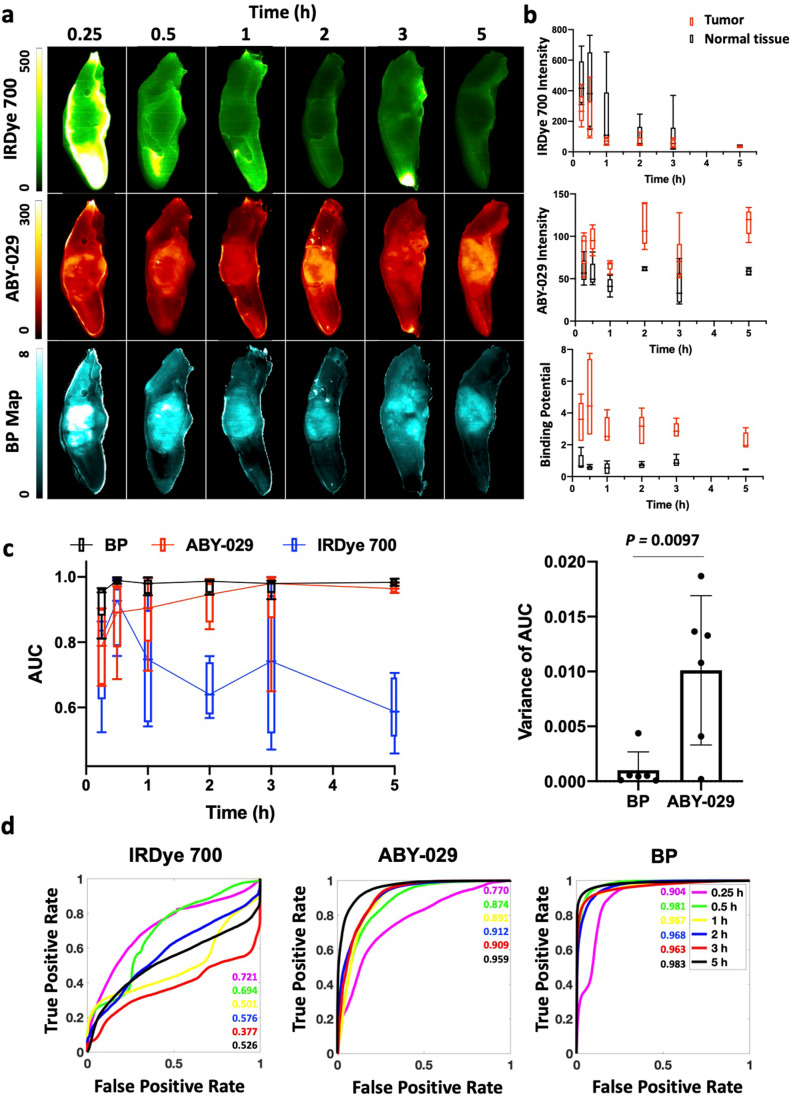
Fig. 5.
Comparison of administration-to-imaging time for PAI and SAI. a Representative images of the xenograft FaDu model are shown for SAI and PAI at each time point. b The average signals of tumor and normal tongue for each time point were graphed. BP is fairly constant over the 5-h period, while fluorescence signal decreases for IRDye 700DX and increases for ABY-029 over time. c ROC analysis indicates diagnostic abilities of ABY-029 and BP improve over time; however, BP outperforms ABY-029 images, especially at short administration-to-imaging time points.

