
Fig. 1.
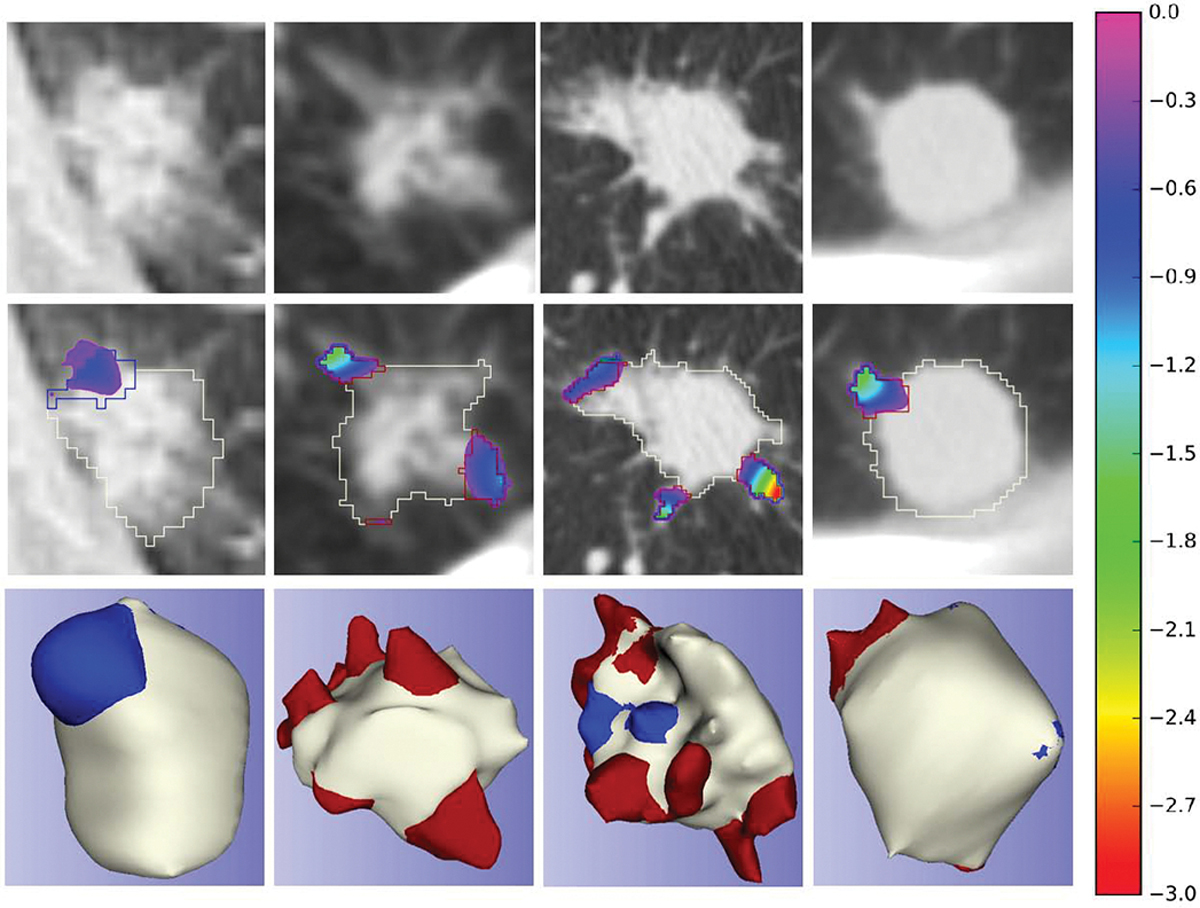
Nodule spiculation quantification dataset samples; the first row - input CT image; the second row - superimposed area distortion map [8] and contours of each classifications on the input CT image; the third row - 3D mesh model with vertices classifications; red: spiculations, blue: lobulations, white: nodule