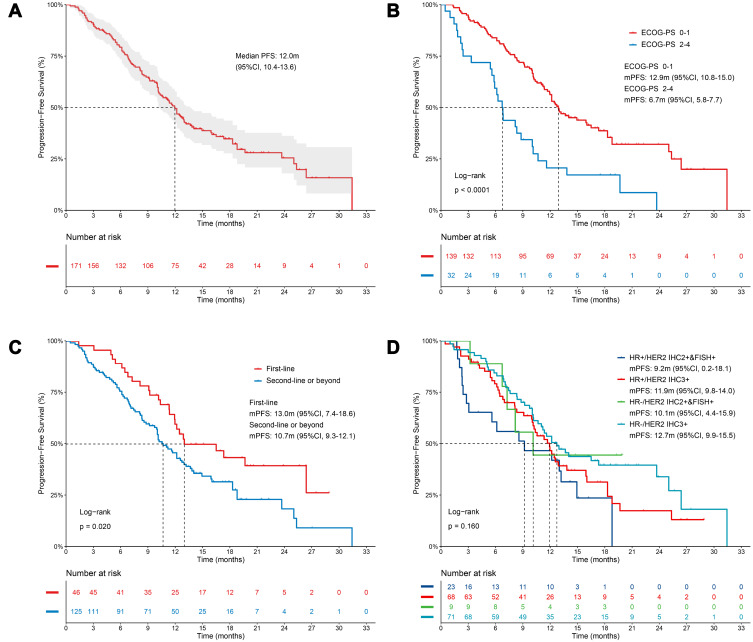
Figure 2.
Kaplan-Meier estimates of progression-free survival. (A) Survival analysis for all patients (n=171). (B) Survival analysis according to ECOG PS. (C) Survival analysis according to the lines of pyrotinib-based therapy. (D) Survival analysis according to the status of HR and HER2. P-values are from univariate Log rank tests.

