Fig. 4.

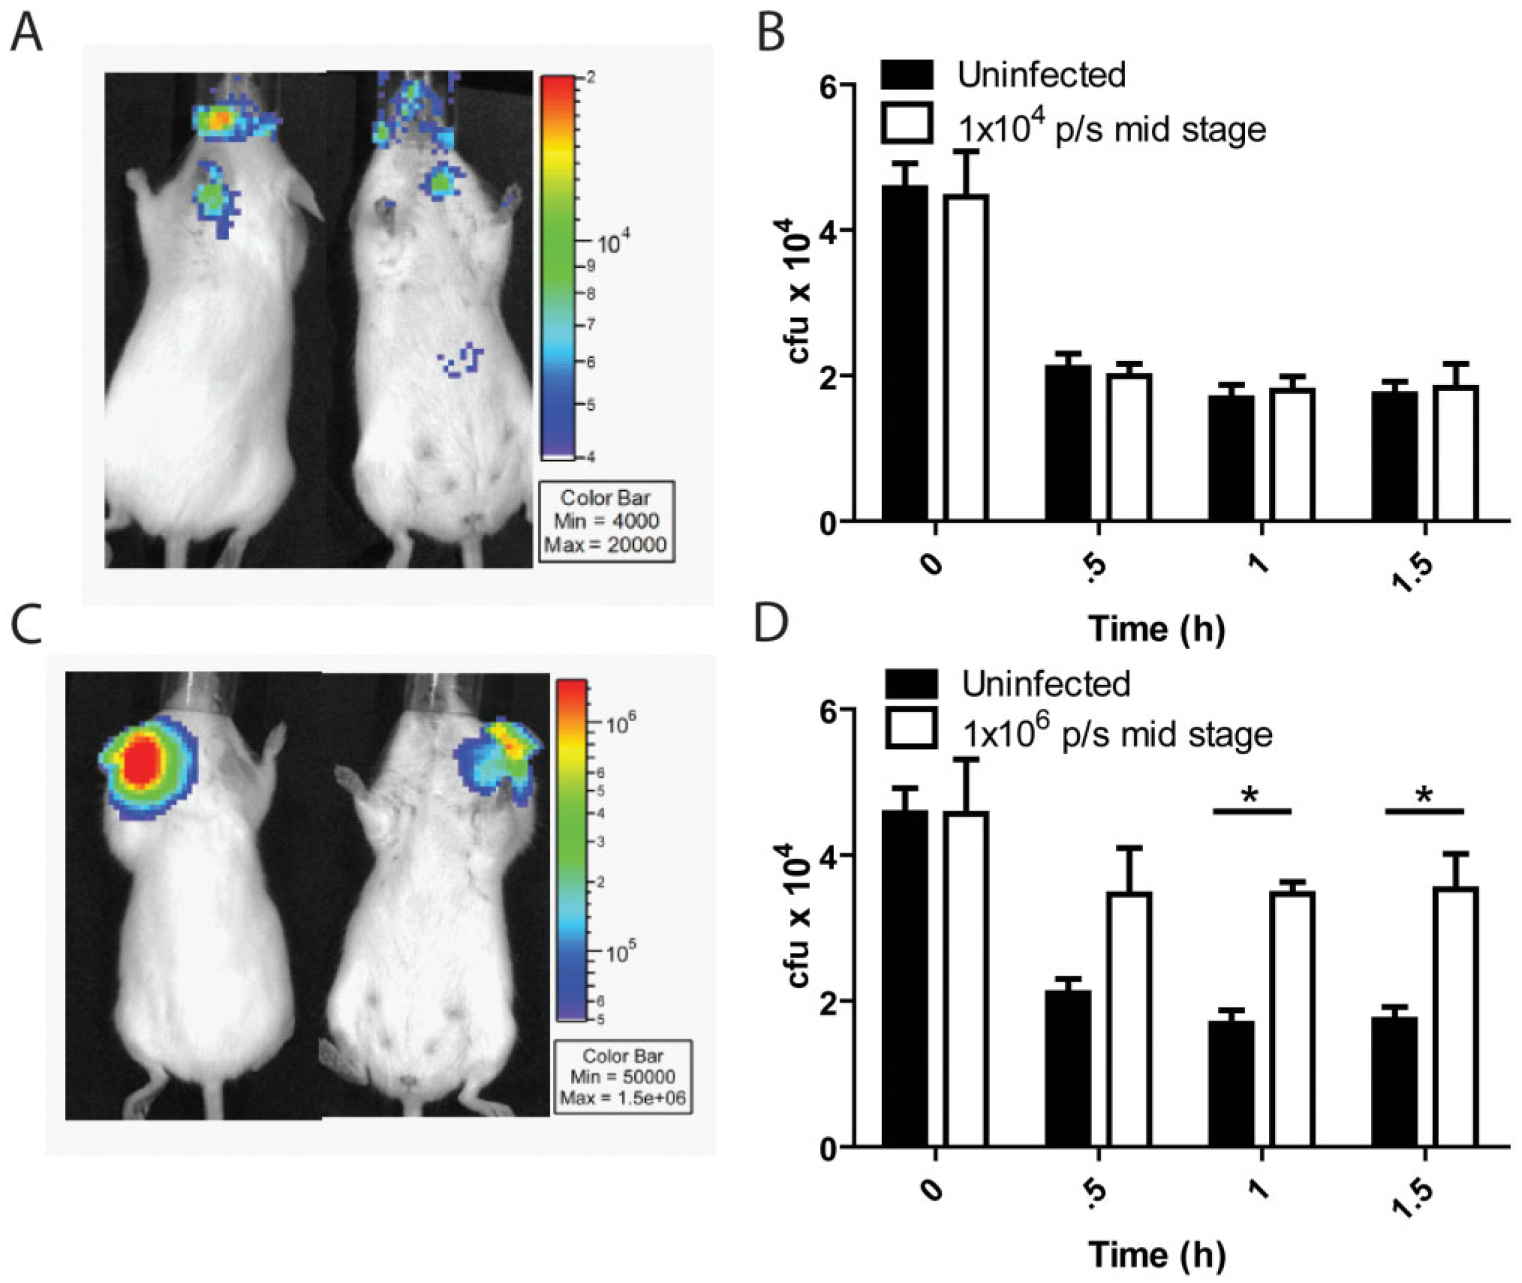
PMN killing ability is attenuated during active infection. (A–D) A/J mice were infected with 1 × 10⁵ spores of BIG23 and infection was monitored by production of luminescence.
A. Black and white photograph of a single representative A/J mouse, overlaid with a false colour representation of photon emission intensity as indicated by the scale on the right in p s−1 cm−2 sr−1, representing a mid-stage of infection where luminescence does not exceed 1 × 10⁵ p s−1 cm−2 sr−1.
B. Comparison of PMN killing of vegetative TKO between PMNs isolated from un-infected mice and PMNs isolated from mice at a mid-stage of infection where luminescence did not exceed 1 × 10⁵ p s−1 cm−2 sr−1. No significant differences in PMN killing ability were seen at any point.
C. Black and white photo of a single representative A/J mouse, overlaid with a false colour representation of photon emission intensity as indicated by the scale on the right in p s−1 cm−2 sr−1, representing a mid-stage of infection where luminescence is at or exceeds 1 × 10⁶ p s−1 cm−2 sr−1.
D. Comparison of PMN killing of vegetative TKO between PMNs isolated from un-infected mice and PMNs isolated from mice at a mid-stage of infection where luminescence was at or exceeded 1 × 10⁶ p s−1 cm−2 sr−1. Significant differences were seen at 1 h (*P < 0.05) and 1.5 h (*P < 0.05). n = 3 mice for each experimental condition.
