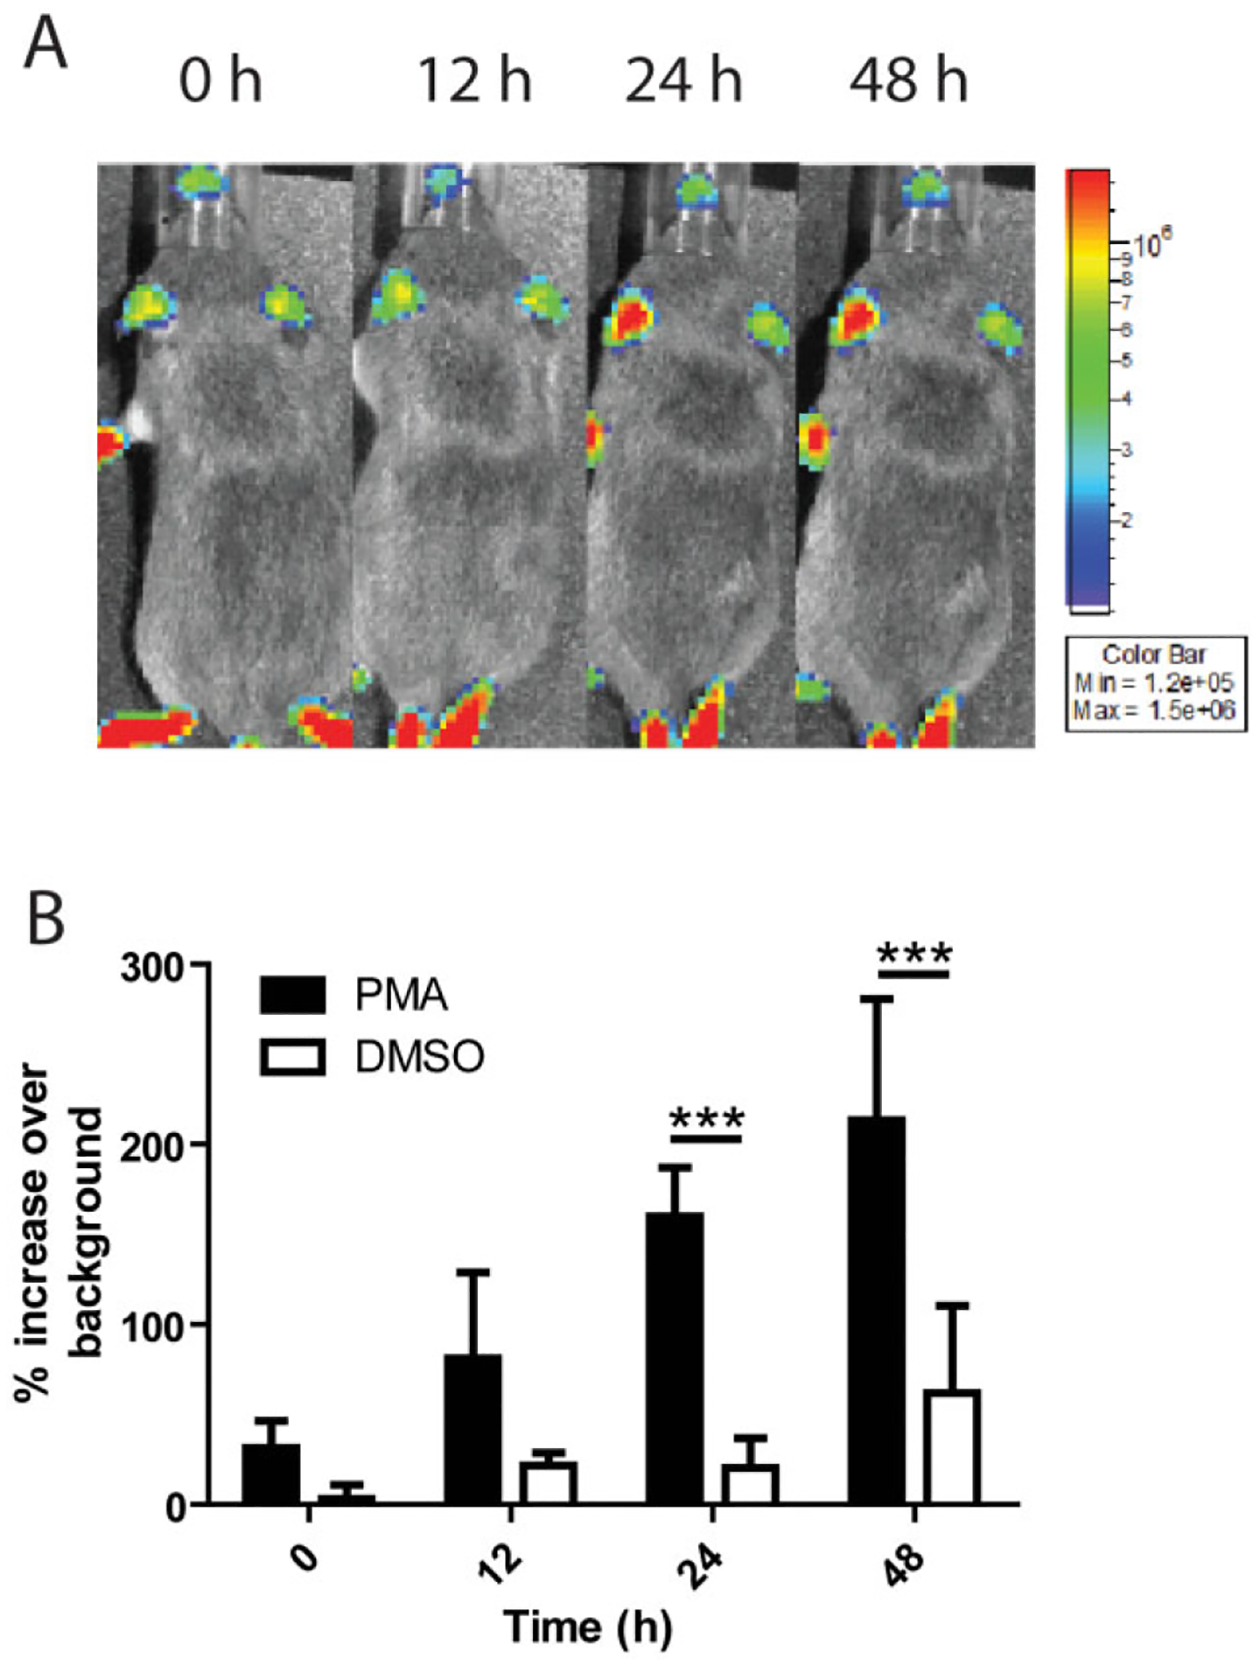
Fig. 5.

PMN accumulation at sites of inflammation can be measured in real time.
A. Black and white photos of a single representative NECre luc mouse with 2.5 μg PMA in 5 μl DMSO pipetted onto the ear, overlaid with a false colour representation of photon emission intensity as indicated by the scale on the right in p s−1 cm−2 sr−1 over a 48 h time-course.
B. Mice were treated with either PMA or DMSO on the left ear and luminescence was quantified over time for both the treated and non-treated ear. Percentage increase in luminescence over background was then calculated, and PMN recruitment to PMA and DMSO vehicle (n = 4) control were determined where significant differences were seen at time 24 h (***P < 0.001) and 48 h(***P < 0.001). n = 6 mice per condition unless otherwise noted.
