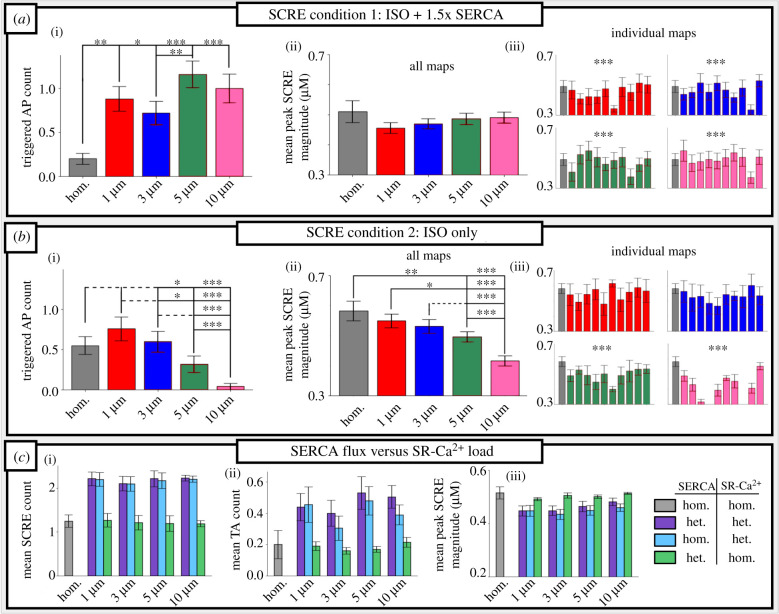
Figure 6.
Impact of SERCA2a heterogeneity on spontaneous calcium release events. Statistical summary of SCRE behaviour for condition 1 (a) and condition 2 (b), showing triggered AP count (i) and mean peak SCRE CaT magnitude across all simulations (ii) and for each individual map (iii). (c) The comparison of mean SCRE count (i), TA count (ii) and SCRE magnitude (iii) for different combinations of heterogeneous/homogeneous SERCA2a maps and SR-Ca2+ load. (Online version in colour.)

