Figure 1.
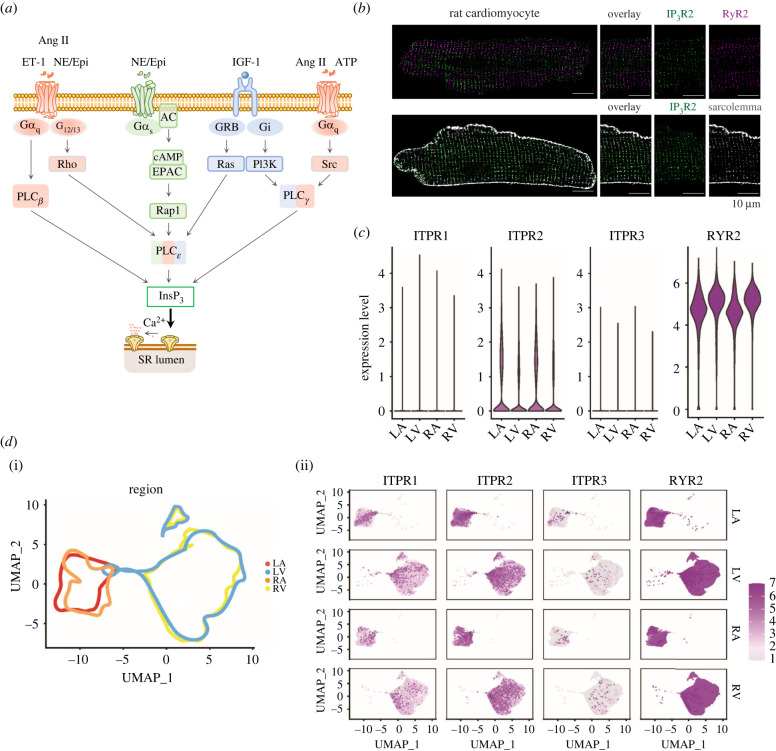
InsP3R expression in the heart. (a) InsP3 is generated by activated phospholipase C (PLC) following the engagement of G-protein coupled receptors (GPCRs) liganded by either angiotensin II (Ang II; angiotensin receptor, AT1), endothelin-1 (ET-1; endothelin receptor, ET receptors), adenosine triphosphate (ATP; purinergic receptors, P2Y), the catecholamines (CA; α and β-adrenoreceptors, α-AR and β-AR) epinephrine (Epi) and norepinephrine (NE) and insulin-like growth factor 1 (IGF-1; IGF-1 receptor, IGF-1R). After diffusion into the cytosol or the nucleus, InsP3 binds to each subunit within the InsP3R tetramer leading to channel opening and release of Ca2+ from intracellular Ca2+ storage sites. (b) InsP3R2 localization relative to RyR2 (top) and t-tubules (bottom). InsP3Rs are stained in green, RyRs are stained in purple and the t-tubules (Caveolin (Cav3)/NCX) are in grey. A 4× zoom of the white square is shown. (c) Log normalized expression of the genes encoding the three inositol 1,4,5-trisphosphate receptors (ITPR1-3) and the gene encoding the type 2 RyR (RYR2) in the cardiomyocyte single nucleus RNA-Seq from each of the four heart chambers. (d) (i) Uniform Manifold Approximation and Projection for dimension reduction (UMAP) embedding of the cardiomyocytes from the four heart chambers including 14 772 nuclei from left atrium (LA), 41 699 nuclei from left ventricle (LV), 8711 nuclei from right atrium (RA) and 30 915 nuclei from right ventricle (RV). These data are from a recent publication by Litviňuková et al. [9], which included transcriptomes of cardiomyocyte nuclei harvested from 14 individuals from two main sources (Harvard Medical School and Wellcome Sanger Institute) and that were processed using Chromium Controller (10× Genomics). Dots representing the nuclei within the UMAP are removed and lines encompassing the nuclei per heart chamber are retained to illustrate the distribution of the nuclei from each heart region relative to other regions in the UMAP. (ii) Distribution of the ITPR
/RyR2 expressing cardiomyocytes across the separated heart regions (colour intensity is binned according to the maximum log normalized value of RyR2 expression).

