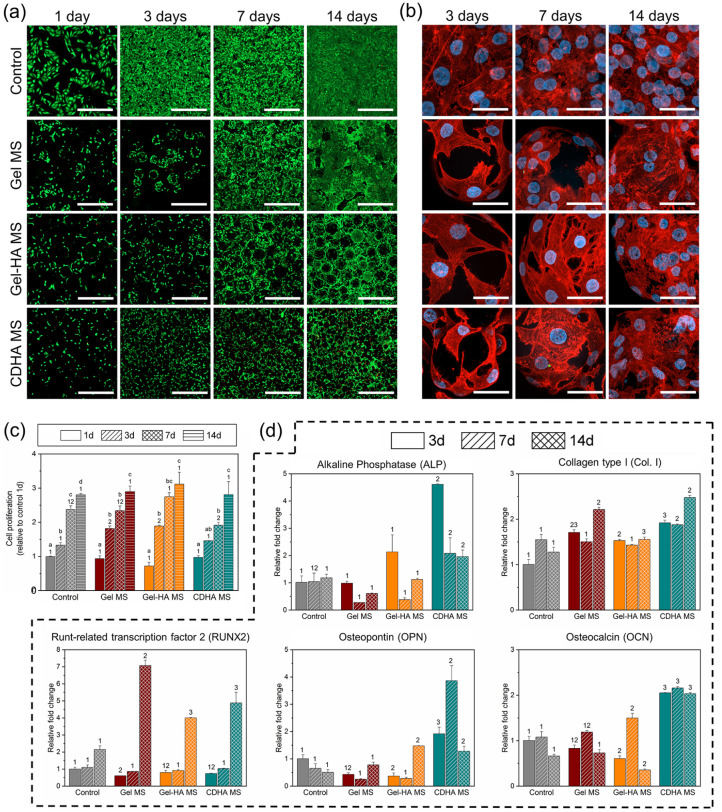
Figure 3.
Behaviour of MG-63 cells cultured on the different MS. (a) Live/dead staining images at day 1, 3, 7 and 14. Live cells stained in green and dead cells in red. Scalebar represents 500 µm. (b) Cell morphology pictures at 3, 7 and 14 days of culture. Cell nuclei in blue and actin fibres in red. Scalebar represents 40 µm. (c) Cell proliferation measured through resazurin-based method. (d) Gene expression of osteogenic markers for the cells seeded in the MS at day 3, 7 and 14. Control samples at day 3 were used as a reference to determine the fold changes. Different letters indicate statistically significant differences between time points in the same condition and different numbers indicate statistically significant differences between conditions at each time point (p < 0.05).

