Figure 4.
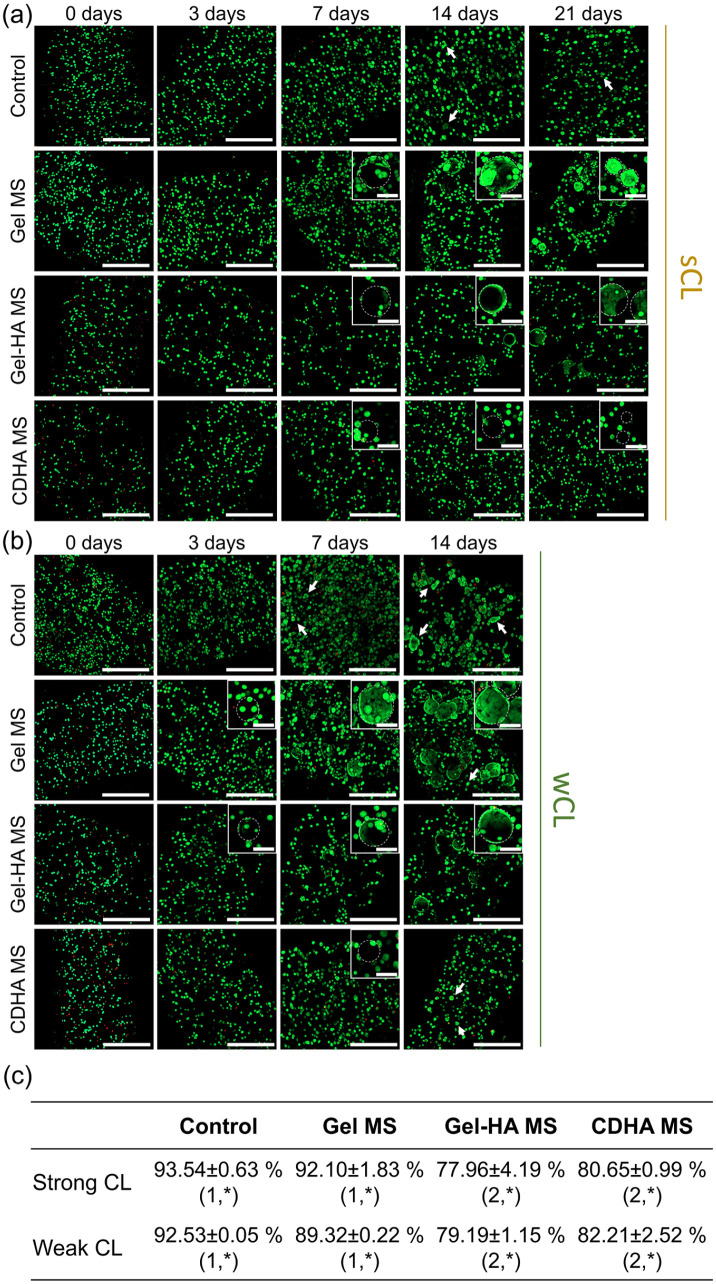
Evolution of MG-63 cell viability in the different bioinks. Live/dead images of the bioinks with sCL (a) and wCL (b) at 0, 3, 7, 14 and 21 days of culture. Live cells stained in green and dead cells in red. Insets show magnification of cells attached to the different MS. Dashed circles indicate MS, and arrows cell clusters forming spheroids. Scalebars represent 500 µm for the full images and 100 µm for the insets. (c) Quantification of the cell viability at day 0, immediately after the bioinks extrusion. Different numbers indicate statistically significant differences between conditions for each CL and different symbols indicate statistically significant differences between cross-linkings within the same condition (p < 0.05).

