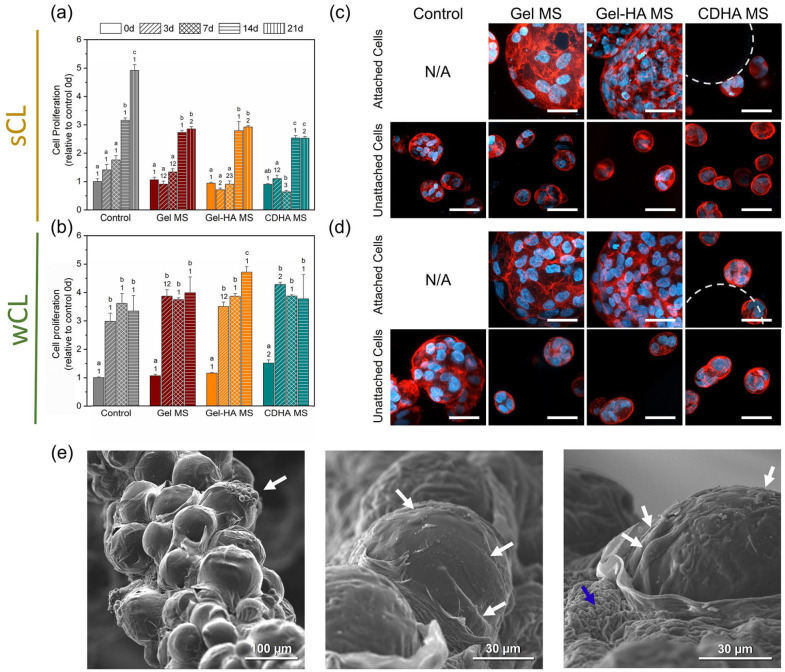
Figure 5.
Cell behaviour in the developed bioinks. (a) Cell proliferation results of the sCL samples and (b) of the wCL condition along the study. Different letters indicate statistically significant differences between time points in the same condition and different numbers indicate statistically significant differences between conditions at each time point (p < 0.05). (c) Cell morphology in the sCL bioinks at day 21 and (d) in the wCL bioinks at day 14, observed by fluorescence confocal microscopy. Top rows show cells attached to the MS inside the bioinks, bottom rows exhibit unattached cells suspended within the cell-laden ink. Nuclei in blue and actin fibres in red. Dashed circles indicate CDHA MS. Scalebars denote 50 µm. (e) SEM images of the wCL Gel MS bioink. White arrows indicate cells attached and spread on the MS, blue arrow indicates alginate.

