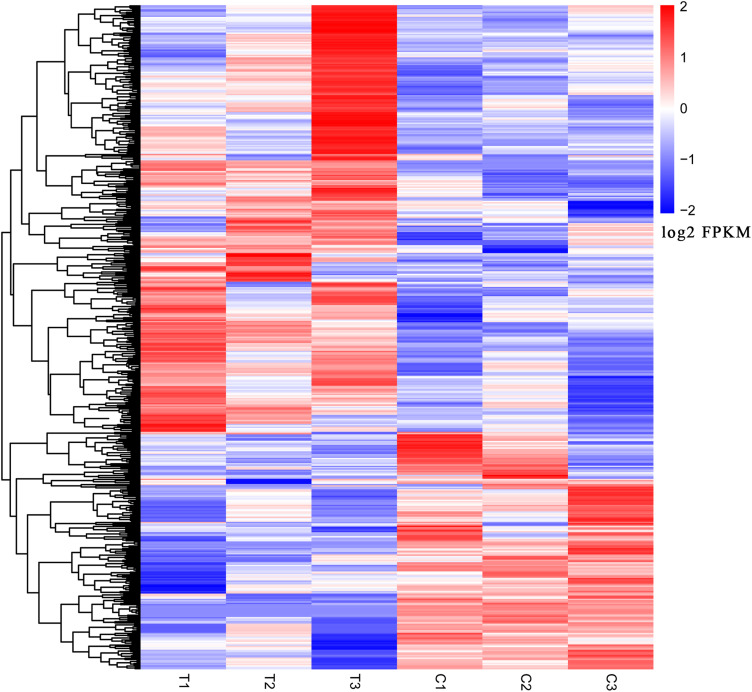
Figure 1.
Genes differentially expressed in the slow transit constipation and control groups. T1, T2, and T3 indicate slow transit constipation tissue; C1, C2, and C3 indicate normal colon tissue. The blue–white-red gradient indicates the expression level of the gene, blue indicates a lower expression level and red a higher expression level.

