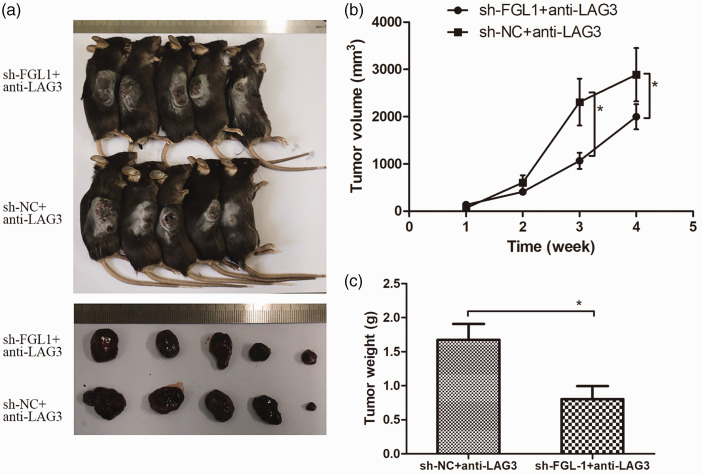
Figure 6.
Anti-LAG-3 drug response assay in tumor-bearing mice. Tumor-bearing mice and tumor masses in the FGL-1-sh + anti-LAG-3 and sh-NC+anti-LAG-3 groups (a). Tumor growth curves of the anti-LAG-3 experiment (b) and Comparison of tumor weights between the FGL-1-sh+anti-LAG-3 and NC-sh+anti-LAG-3 groups (c). *p < 0.05; two-tailed Student’s t-test.

