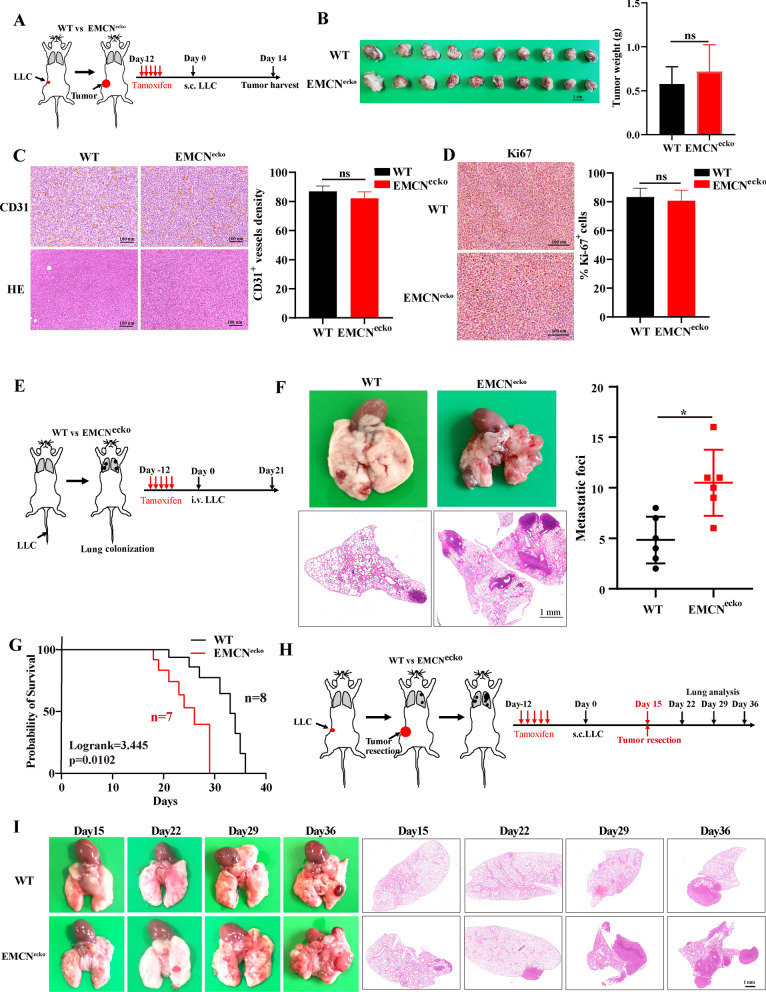
Fig. 2.
EMCN in ECs does not affect tumor growth or angiogenesis and aggravates spontaneous lung metastasis from subcutaneous syngeneic tumors. A The schematic diagram shows the experimental design of tamoxifen induction, subcutaneous implantation of LLC tumor cells and tumor harvest. B LLC cells were subcutaneously injected into WT and EMCNecko mice for 14 days. LLC tumors were dissected and photographed (left). Tumor weight was measured by a precision balance (right, data represent the mean ± SD, n = 10 mice per group). Statistical analysis was performed using unpaired Student’s t test. **p < 0.01. C Representative CD31 staining and HE images of tumor sections from WT and EMCNecko mice (left panel) are shown. CD31 indicates vascular density. Quantification of CD31 expression was performed (right panel). (Data represent the mean ± SD, n = 4). Statistical analysis was performed using unpaired Student’s t test. ns: not significant. Scale bars: 100 μm. D Representative Ki67 staining images of tumor sections from WT and EMCNecko mice are shown (left panel). Quantification of Ki67 expression was performed (right panel) (data represent the mean ± SD, n = 4). Statistical analysis was performed using unpaired Student’s t test. Ns, not significant. Scale bars, 100 μm. E The schematic diagram shows the experimental design of tamoxifen induction, intravenous injection of LLC tumor cells and pulmonary analysis. F Representative images of lungs harvested from WT and EMCNecko mice after 21 days of LLC tumor implantation (left, n = 6). Metastatic foci were quantified (right, data represent the mean ± SD, n = 6). Statistical analysis was performed using unpaired Student’s t test. *p < 0.05. G Overall survival of intravenous pulmonary metastasis in WT and EMCNecko mice. EMCNecko (n = 7), WT (n = 8). The EMCNecko mouse groups showed worse overall survival (p = 0.0102). Statistical analysis was performed using the log-rank test. H The schematic diagram shows the experimental design of tamoxifen induction, subcutaneous implantation of LLC tumor cells, tumor resection and lung analysis at different time points. I Representative HE-stained images of lung sections from WT and EMCNecko tumor-bearing mice at different time points after surgery. The left panel shows lung metastasis images, and the right panel shows HE-stained sections

