Figure 2.

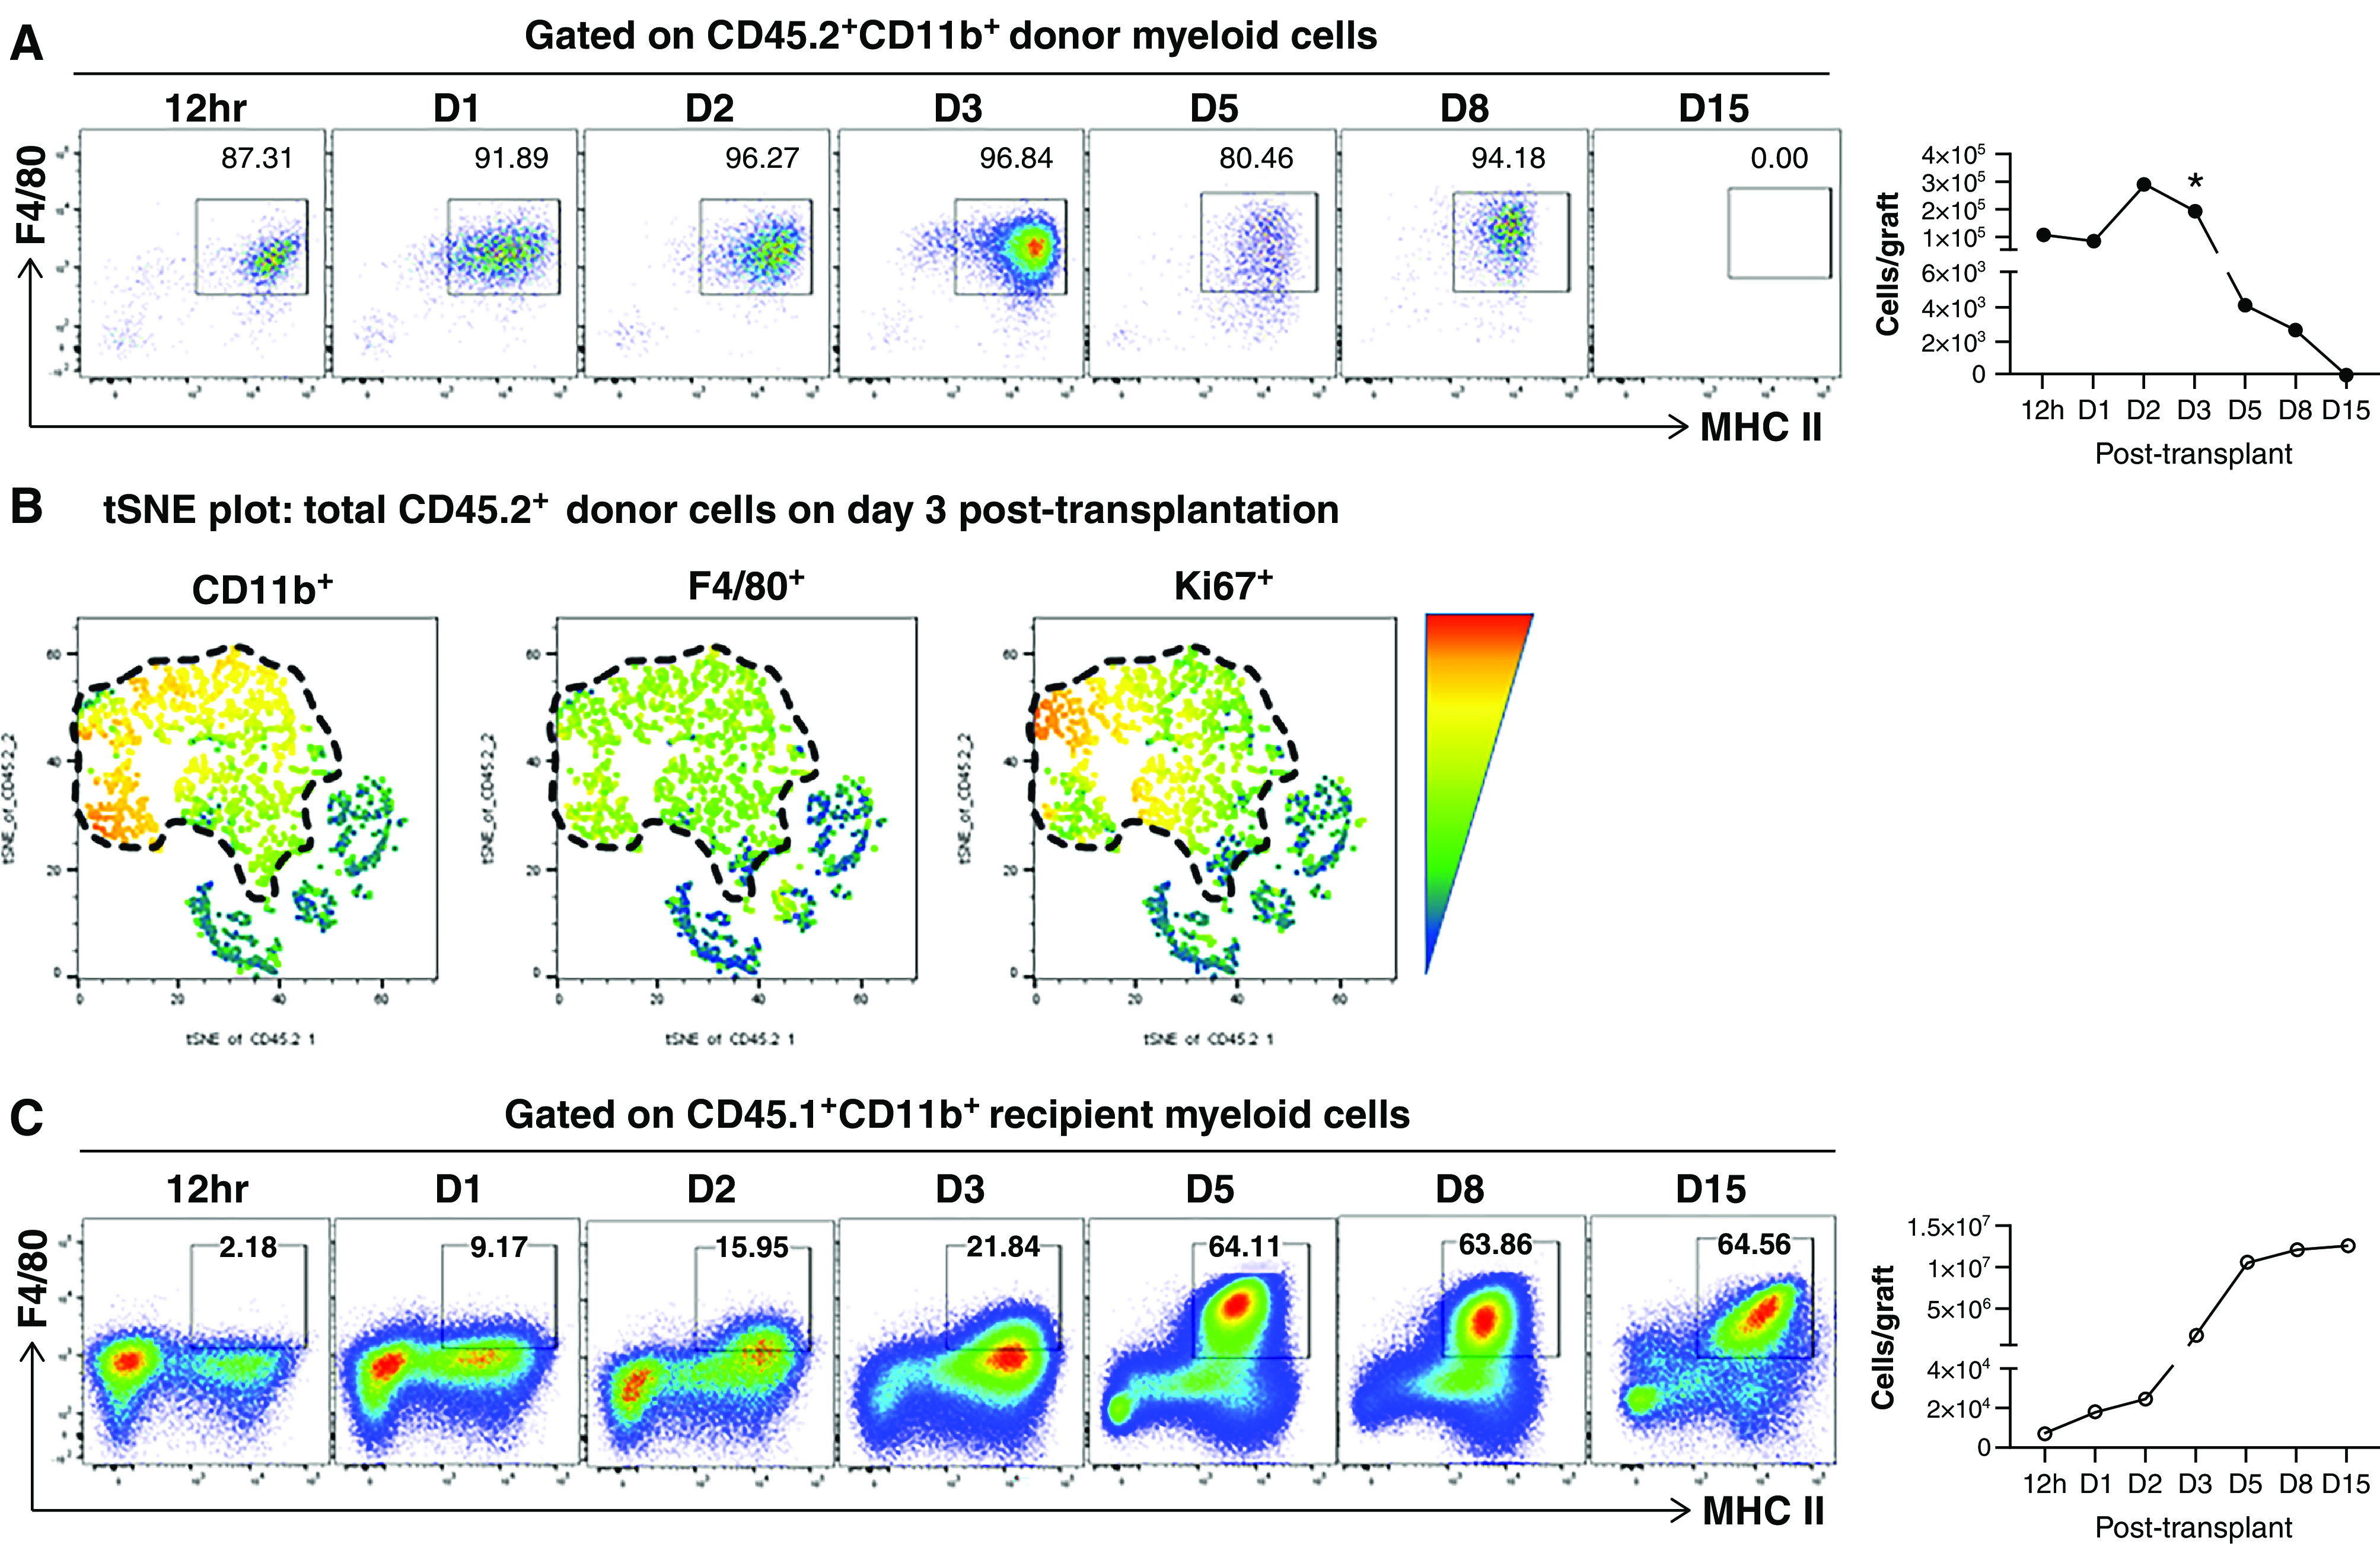
Donor and recipient kidney macrophage numbers show kinetic changes post-transplantation. (A) Representative FACS plots demonstrating the kinetics of donor kidney resident macrophages (F4/80HIMHC-IIHI) at indicated time points post-transplantation. Cells were gated on total live CD45.2+CD11b+ donor myeloid cells. The line graph on the right depicts the average absolute number of donor kidney resident macrophages present in the allograft at indicated time points (n=2–5 per time point). Data are presented as mean±SD. *P<0.05, calculated using unpaired t test by comparing with the absolute numbers of kidney resident macrophages in three age-matched untransplanted BALB/c kidneys at each time point. (B) T-distributed stochastic neighbor embedding (tSNE) plots of CD11b+, F4/80+, and Ki76+ of all donor (CD45.2+) cells in kidney allografts on day 3 post-transplantation. Cells were gated on total live CD45.2+ donor cells. Donor CD11b+ myeloid cells are outlined by the dashed line in the left tSNE plot. Their expression of F4/80 and Ki67 are outlined by the same dashed line in the next two tSNE plots. (C) Representative FACS plots demonstrating the kinetics of recipient graft-infiltrating myeloid cells at indicated time points post-transplantation. Cells were gated on total live CD45.1+CD11b+ recipient myeloid cells. The kinetics of recipient F4/80+MHC-II+ macrophage differentiation in the kidney allografts is shown by the progressive increase of the percentage of F4/80+MHC-II+ cells within this gate over time. The line graph on the right depicts the average absolute number of recipient F4/80+MHC-II+ kidney macrophages present in the allograft at indicated time points (n=2–5 per time point). Data are presented as mean±SD. D, day.
