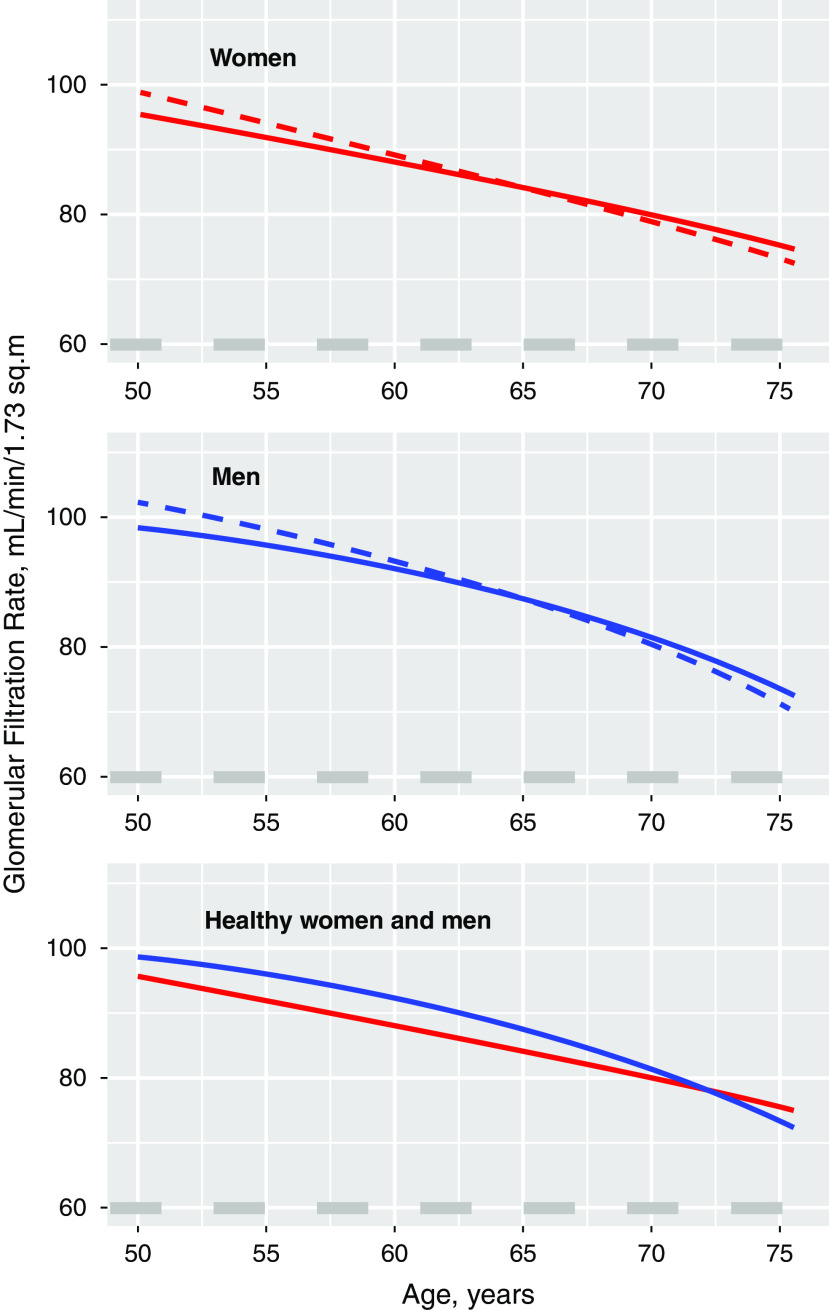
Figure 3.
Mean GFR decline with age for women and men by health status (“healthy” in solid and “not healthy” in dashed). The lower panel depicts the mean GFR decline with age for healthy women versus healthy men. Calculated using a GAMM (model 3, Supplemental Table 2).

