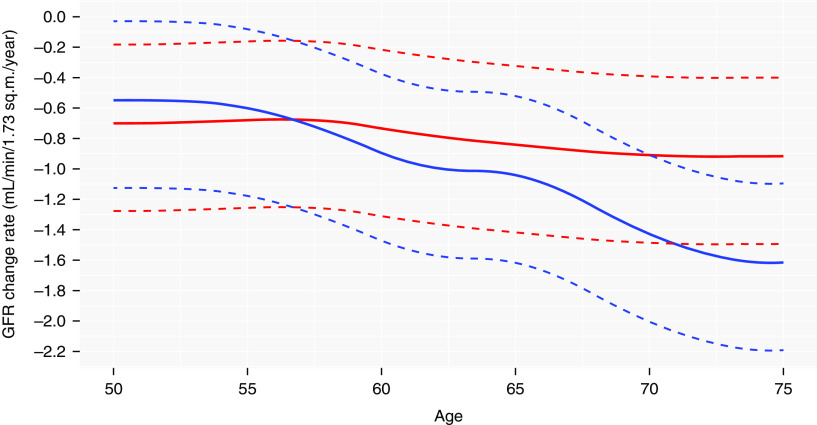
Figure 4.
Sex-specific GFR change rates for healthy women and men as a function of age with 95% reference intervals. The solid lines represent the GFR change rates for women (red) and men (blue). The dashed lines represent the 95% reference intervals estimated from the best linear unbiased predictions of the random slopes of the GAMM in Supplemental Table 2.

