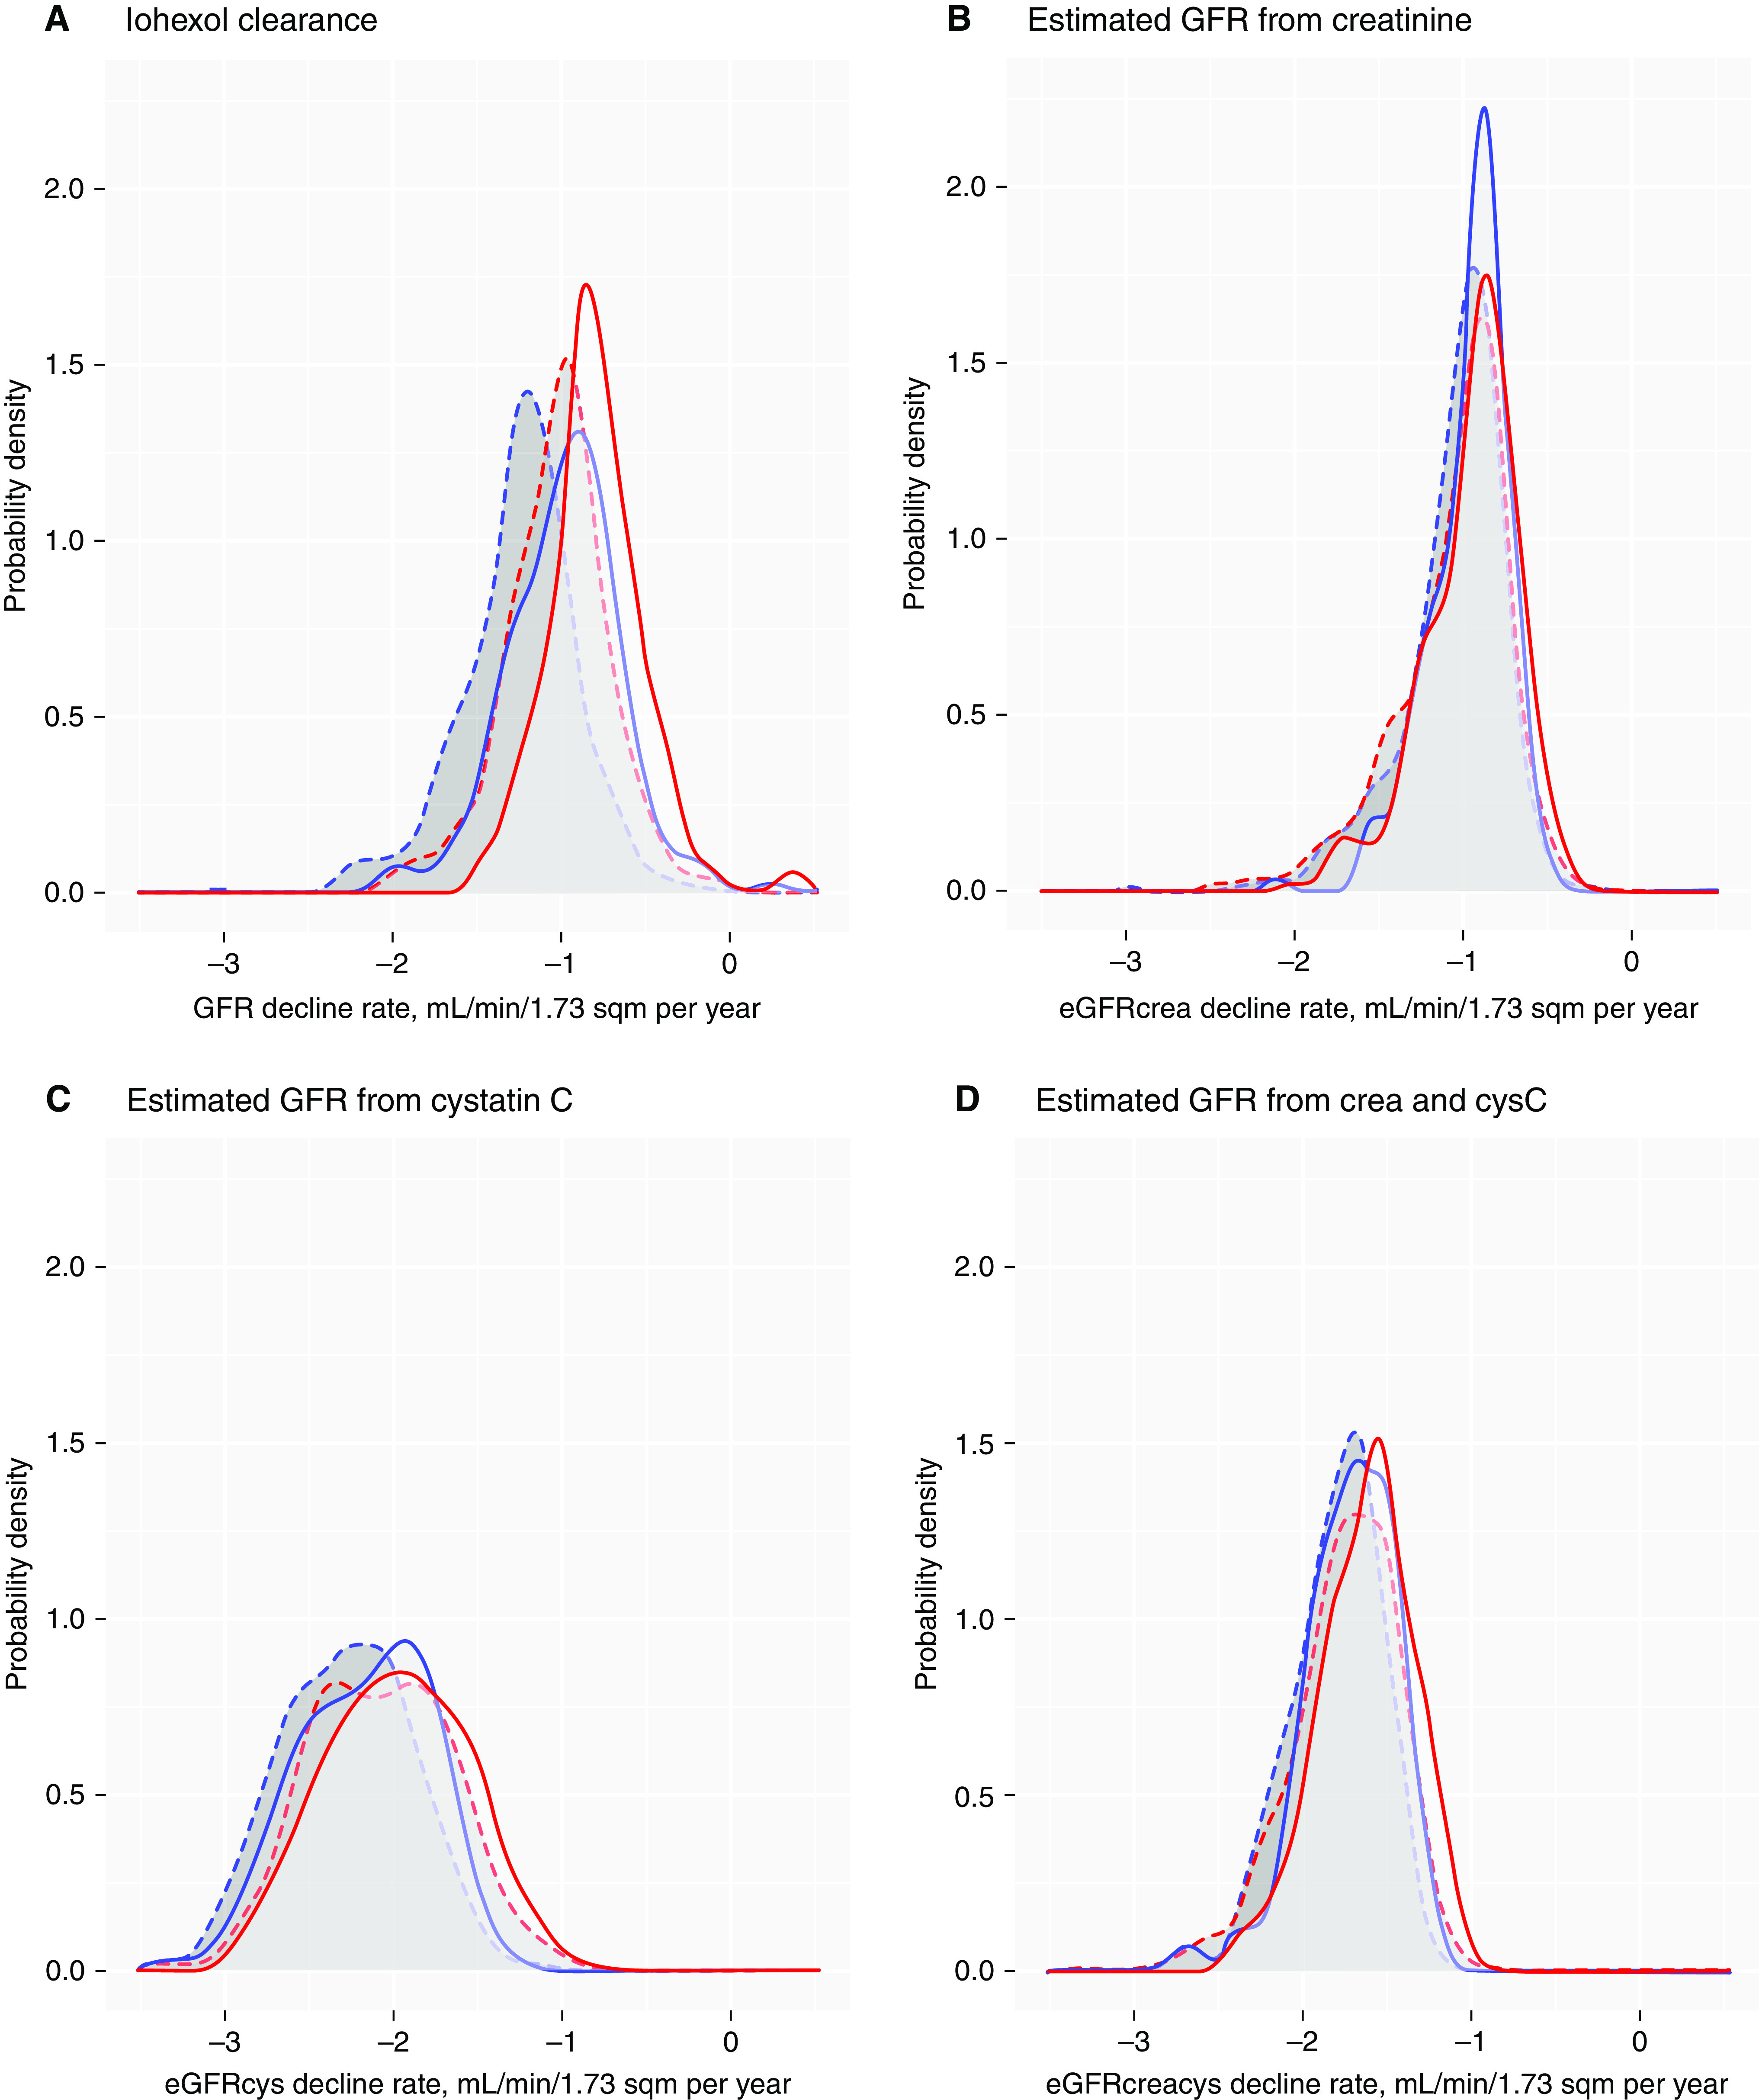
Figure 5.

Smoothed histograms of the distribution of individual predicted mean GFR decline rates. GFR change rates were measured using (A) iohexol clearance and estimated from (B) creatinine, (C) cystatin C, and (D) creatinine and cystatin C for healthy (solid) and unhealthy (dashed) women (red) and men (blue), for participants with at least one follow-up (n=1410). Predicted by the GAMM in model 3, Supplemental Table 2 for mGFR, and Supplemental Table 5 for eGFR.
