
Fig. 2. Differential fibroblast gene expression and secreted protein analysis.
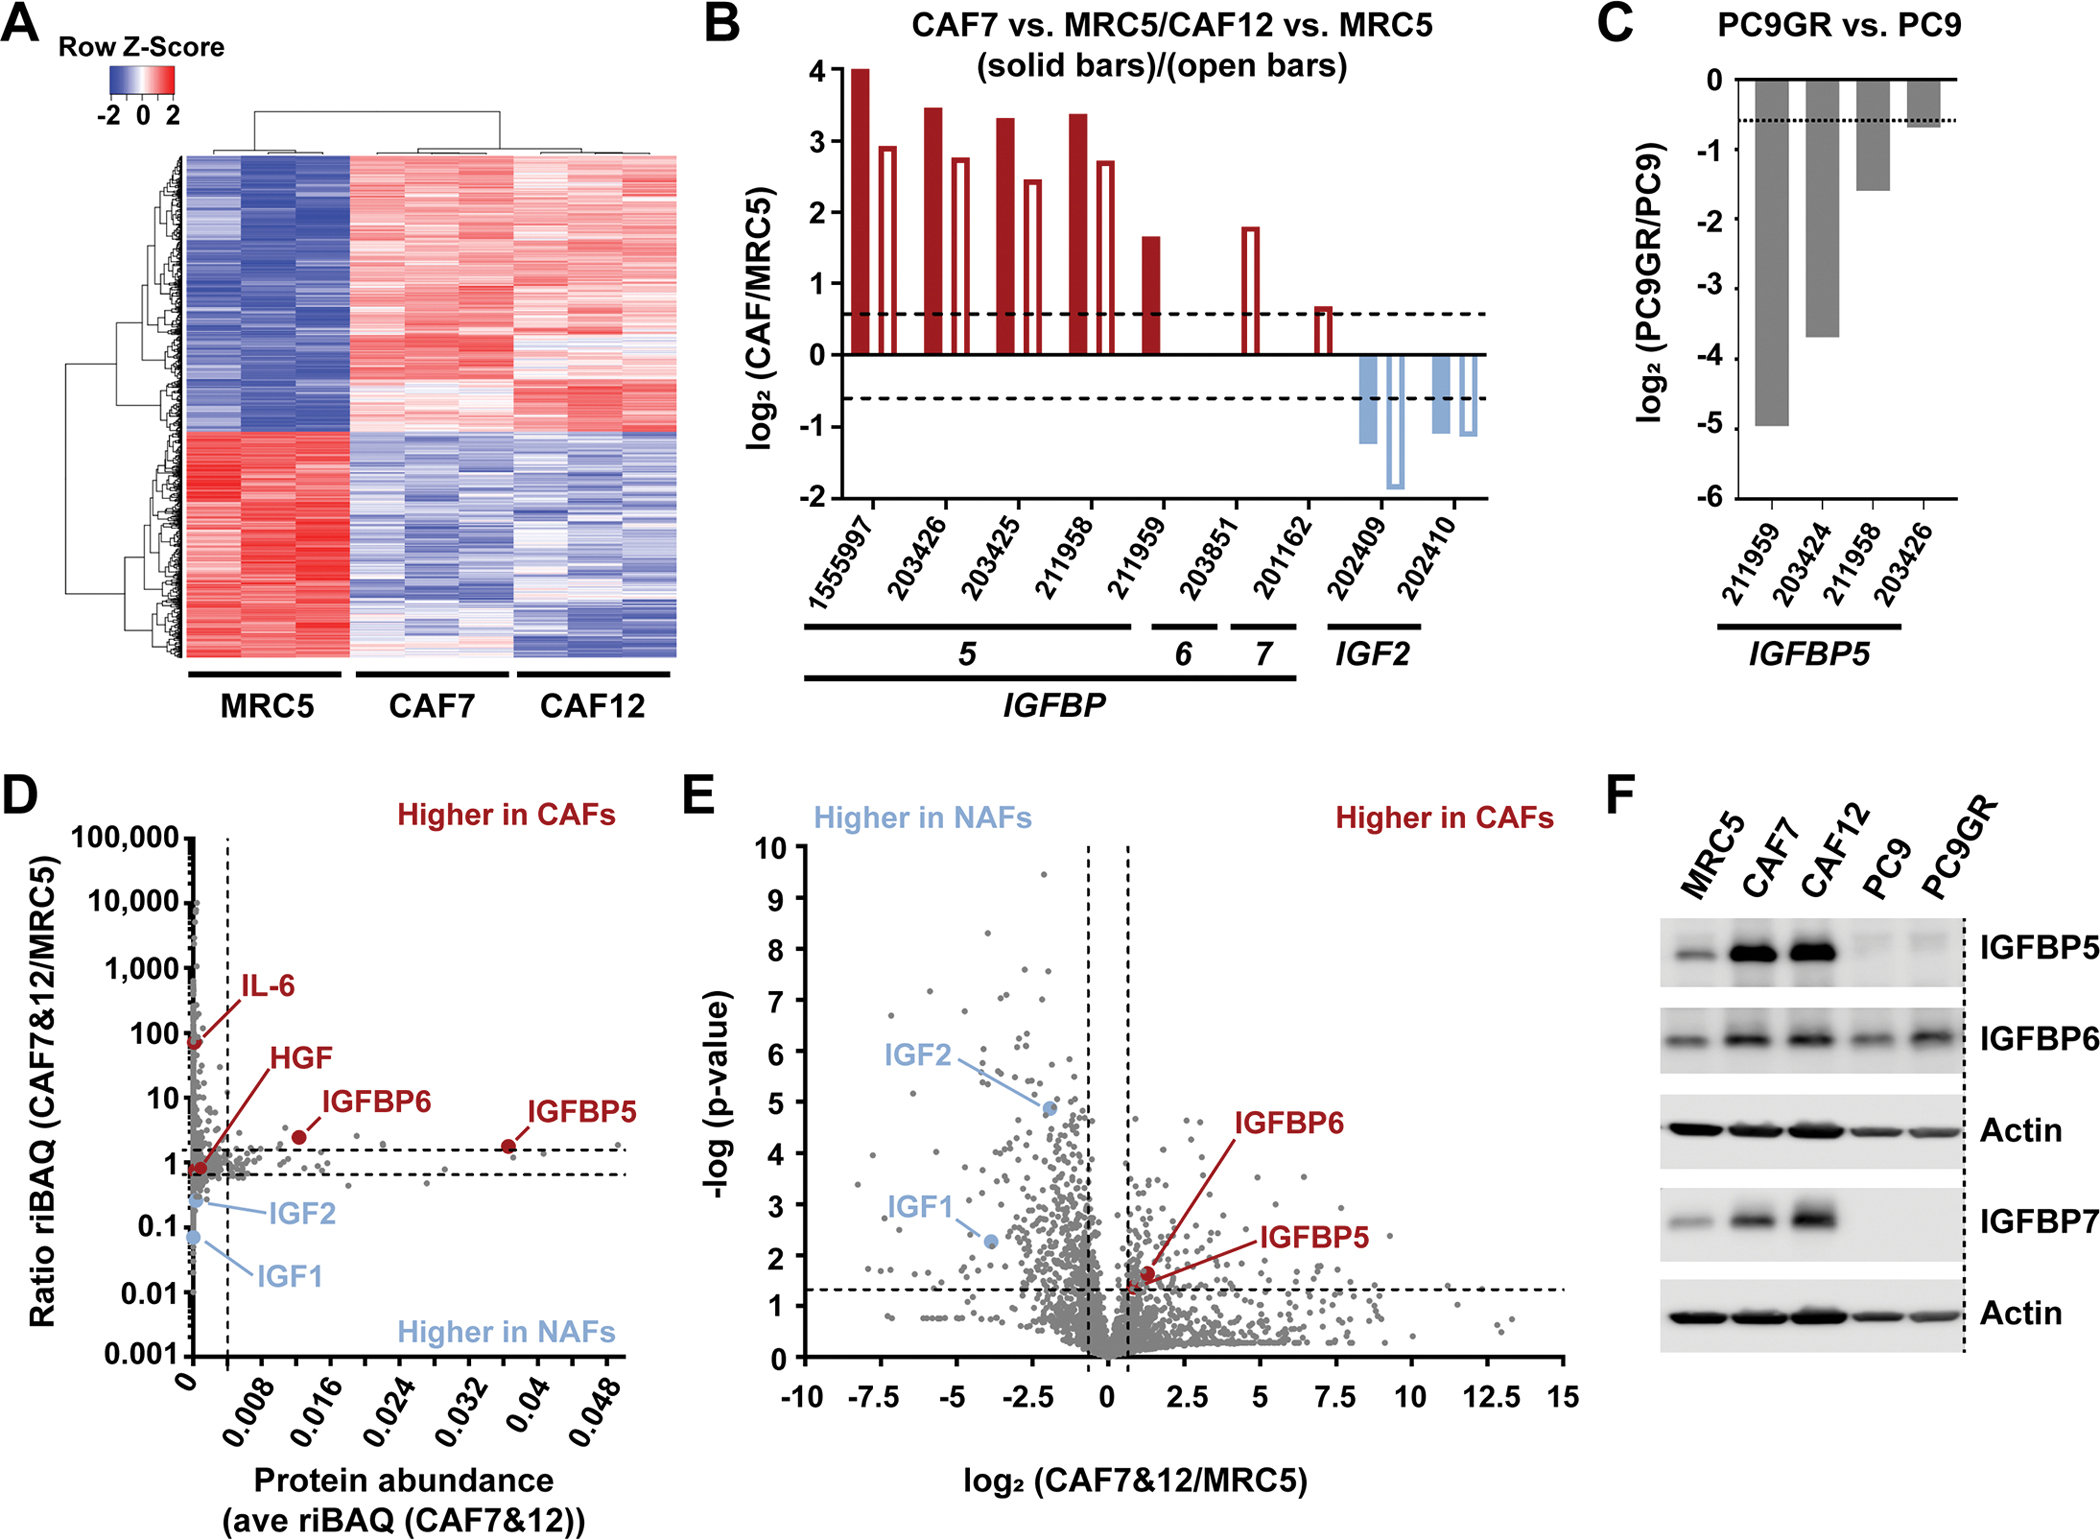
(A) Hierarchical clustering of 1948 differentially expressed gene probes in MRC5, CAF7 and CAF12 (A; see Methods for scoring procedure). (B and C) IGF1R pathway components that were significantly (P<0.05 by two-tailed, two-sample unequal variance t tests) differentially expressed in either CAF7 or CAF12 compared to MRC5 (each n=3 biological replicates; B), and in PC9GR compared to PC9 cells (n=3; C). (D) Comparison of 2,330 proteins identified by secretome analysis based on the average abundance (ave riBAQ) of each protein in CAF7 and CAF12 (n=6) and the ratio of each protein identified in CAF7 and CAF12 compared to MRC5 (n=3). Dashed lines indicate the top 2.5% most-abundant secreted proteins and a ratio of 1.5-fold increased or decreased. (E) Log2 ratio of each secreted protein identified in CAF7 and CAF12 compared to MRC5 and significance of these differences. Dashed lines indicate a log2 ratio of ± 0.58 (1.5-fold increased or decreased) and −log(p-value) greater than 1.3 (P<0.05 by a two-tailed, two-sample equal variance t test), comparing the riBAQ values for CAF7 and CAF12 to the riBAQ values for MRC5 from (D). (F) Western blot analysis of total protein levels of IGFBP5, IGFBP6 and IGFBP7 in the indicated cell lines. Actin, loading control (LI-COR scans in fig. S9). Dashed line indicates removed lanes. Blot shown is representative of two biological replicates.