
Fig. 6. First line targeting of CAF-regulated pathways in NSCLC cells.
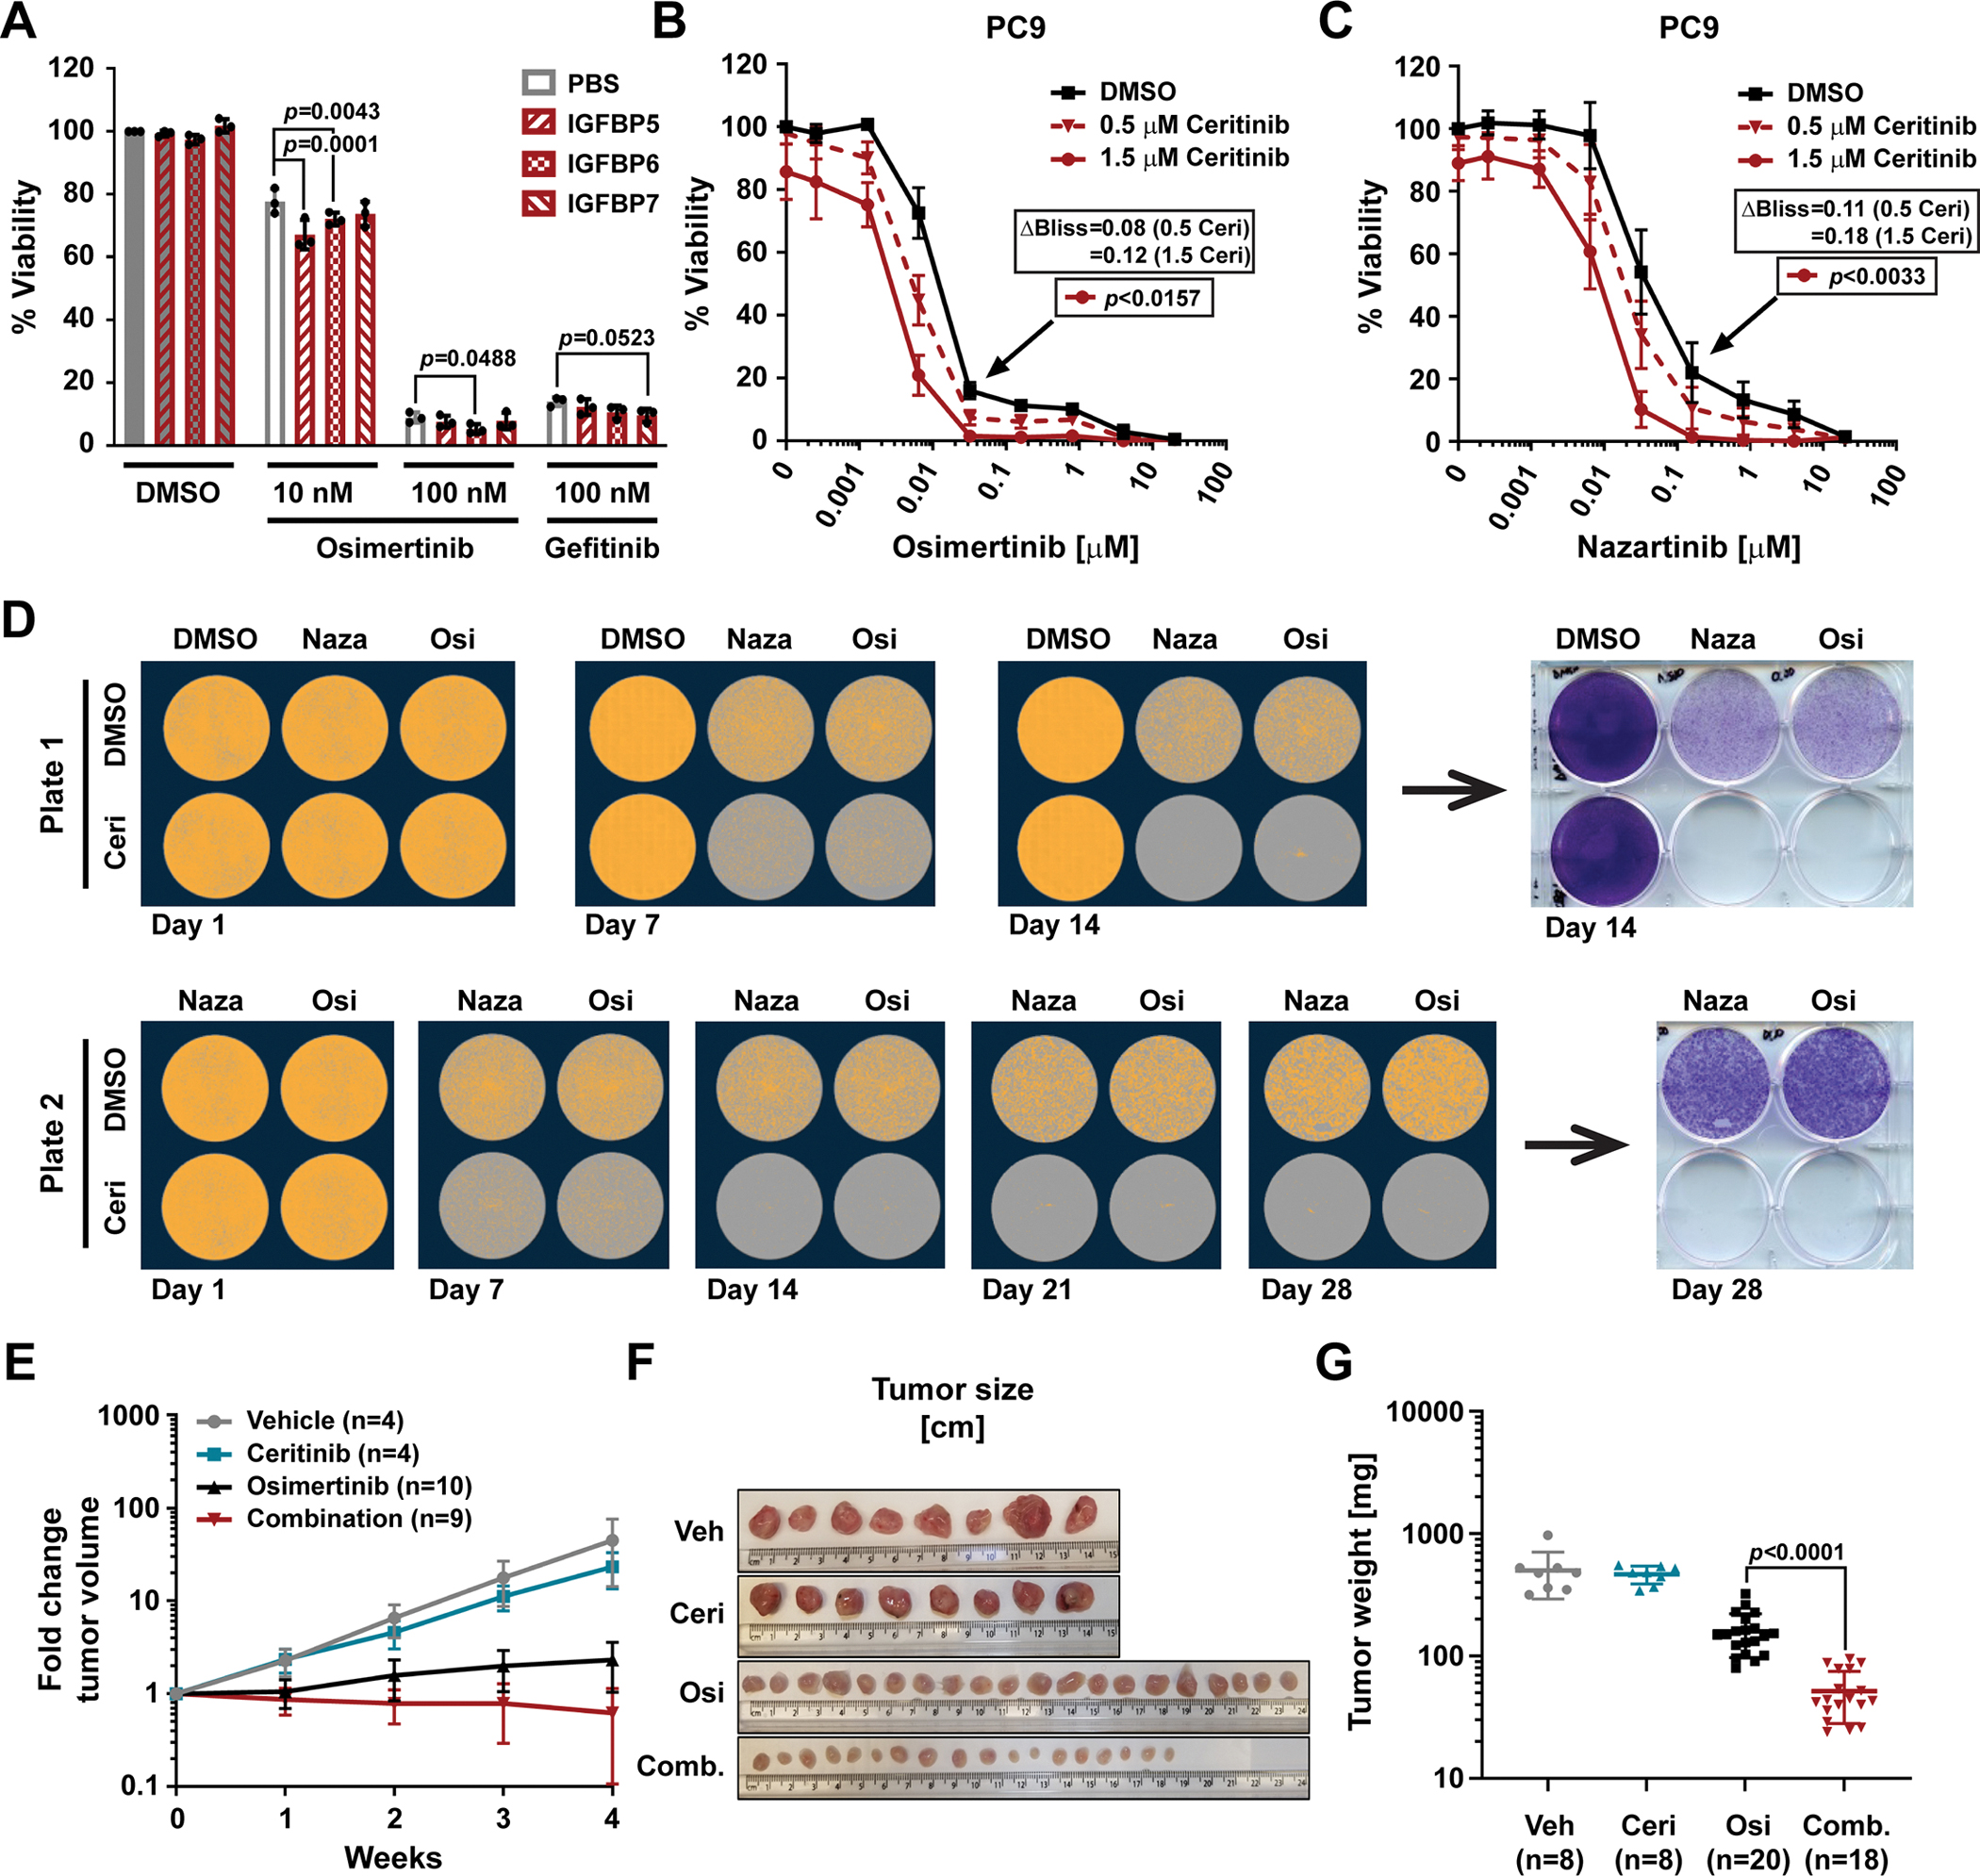
(A) Viability as determined by CTG of PC9 cells plated in RPMI10 containing 10 μg/mL rhIGFBP5, rhIGFBP6 or rhIGFBP7 and treated 24 hours later with osimertinib or gefitinib at the indicated doses for 72 hours. 100% viability was set to total luminescence in DMSO-treated cells plated in RPMI10 containing PBS. Technical replicates within each experiment were averaged before determining the mean ± SD, and significance across all biological replicates (n=3), determined by unpaired t test with single pooled variance. (B and C) Viability as determined by CTG of PC9 cells plated in RPMI10 and treated 24 hours later with osimertinib (B; n=4 experiments) or nazartinib (C; n=3) in combination with DMSO or the stated concentrations of ceritinib for 72 hours. 100% viability was set to total luminescence in DMSO-only treated cells. Data are mean ± SD of at least three biological replicates performed as technical triplicates. Significance determined by unpaired t test with single pooled variance and Holm-Sidak’s multiple comparison test for (B) and (C). Black arrows mark the specific concentration of the respective control curve (in black) compared in each experiment. (D) Clonogenic assay of PC9 cells (0.5×10⁶ cells plated per well) treated with nazartinib (Naza; 500 nM), osimertinib (Osi; 100 nM), and/or ceritinib (Ceri; 1 μM) at day 1 and every 3 to 4 days thereafter for 14 days (Plate 1) or 28 days (Plate 2). Representative images of confluence (orange mask) as determined by live-cell imaging microscopy (quantification in fig. S7B) and crystal violet staining at days 14 and 28 (quantification in fig. S7C). n=4 experiments. (E and F) Tumor volume fold change (E) and width (F) of PC9 mouse xenografts treated with vehicle control (Veh.; 0.5% methyl cellulose/0.5% Tween 80), osimertinib (Osi; 2 mg/kg), ceritinib (Ceri; 25 mg/kg) or the combination of both (Comb.). Data in (E) are mean ± SD of the given number of mice (n). (G) Scatter plot of tumor weight with mean ± SD. n=number of tumors. Significance was determined by two-tailed, unpaired, non-parametric Mann Whitney test.