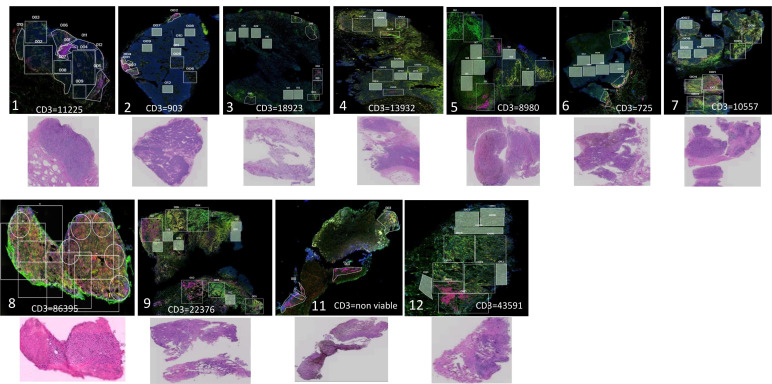
Figure 2.
Analysis of tumor tissue sections. NanoString Digital Spatial Profiling (DSP) low power fluorescent images of pre-treatment tumor tissue; CD3=red, CD11c=yellow, CD163=green, DNA=blue. All images are ‘low power’= 2 mm field of view, 100 x total magnification. Number in left lower corner indicates patient number. Top row, patients with median PFS 1.6 months after lerapolturev. Bottom row, patients with median PFS 2.3 years after lerapolturev. The number of CD3+T cells as assessed by flow cytometry is also shown for each tumor. Below the DSP images, a corresponding H&E stain is also shown. Note for patient 11, the H&E demonstrates near 100% necrotic tissue in the pretreatment biopsy, as such this was dropped from analysis. PFS, progression-free survival.

