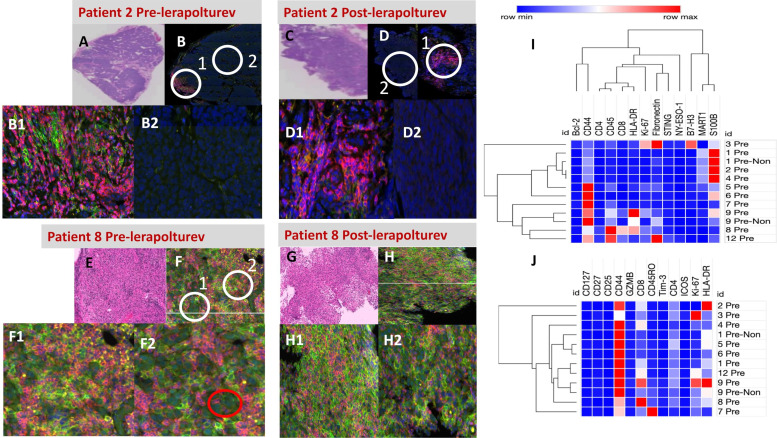
Figure 3.
NanoString Digital Spatial Profiling (DSP) of tumor tissue. Top left and middle panel, ‘low power’ = 2 mm field of view, 100 x total magnification, ‘high power’ = 45 μm field of view, 400 × total magnification. (A, B) Patient 2 prelerapolturev and (C, D) post-lerapolturev tumor. (A, C) Corresponding H&E. (B) DSP low power, fluorescent image, CD3=red, CD11c=yellow, CD163=green, DNA=blue. Same fluorescent markers also present in (D, F, H). B1—High power view of region 1 circled (white circle) in image B. (B2) High power view of region 2 circled (white circle) in image B. (D) DSP image low power, tumor cells can be identified as cells with irregular blue nucleus. D1—High power view of region 1 circled (white circle) in image D. D2—High power view of region 2 circled (white circle) in image D. Bottom left and middle (E, F) Patient 8 prelerapolturev and G, H postlerapolturev tumor. (E, G) Corresponding H&E stains. (F) DSP image low power. (F1) High power view of region 1 circled (white circle) in image F. (F2) High power view of region 2 circled (white circle) in image F. Tumor cells can be identified as cells with irregular blue nucleus depicted in F2, red circle. H- DSP image low power. (H1) High power view of region 1 circled (white circle) in image H. (H2) High power view of region 2 circled (white circle) in image (H. I, J) Heatmaps of selected protein expression obtained from tumor regions of interest in (I) pretreatment tumor tissue and J- CD3+compartment only. Patient identification on the y axis (right), pre-NON is pretreatment tissue collected without lerapolturev injection.

