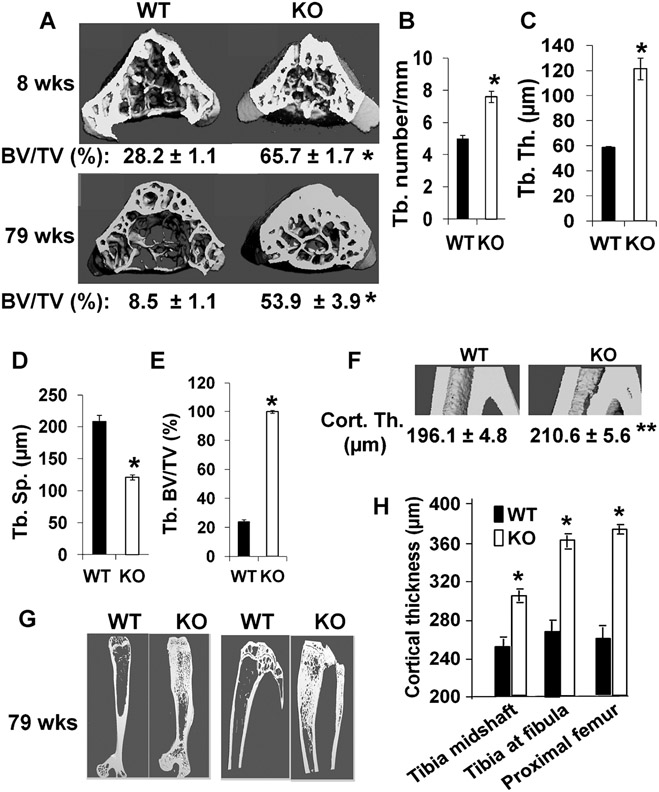
Fig. 2.
Lrrk1−/− mice exhibit osteopetrosis as shown by μCT scans. (A) Cross-section of lumbar vertebra 5 (L5) of 8-week-old and 79-week old WT and KO males. Quantitative data of 8-week-old mice (n = 8, with 4 males and 4 females) and 79-week-old males (n = 7–9) are presented below the images. (B–D) Quantitative measurements of trabecular number (Tb.N), trabecular thickness (Tb.Th), and trabecular spacing (Tb.Sp) at the middle of L5 of 8-week old mice. (E) Quantitative measurements of trabecular bone at the metaphysis of proximal tibia of 8-week-old WT and KO mice. (F) Longitudinal sections of μCT images of tibia from 8-week-old WT and KO mice at the fibular junction. Quantitative measurements of cortical thickness are presented below the panel. (G) Longitudinal sections of μCT images of the femur and tibia of 79-week-old WT and KO males. (H) Quantitative measurements of cortical thickness at the tibia of 79-week-old WT and KO males. Values are expressed as mean ± SEM (n = 8–9). A star represents statistical significance (p < 0.01) when compared to WT littermate controls.

