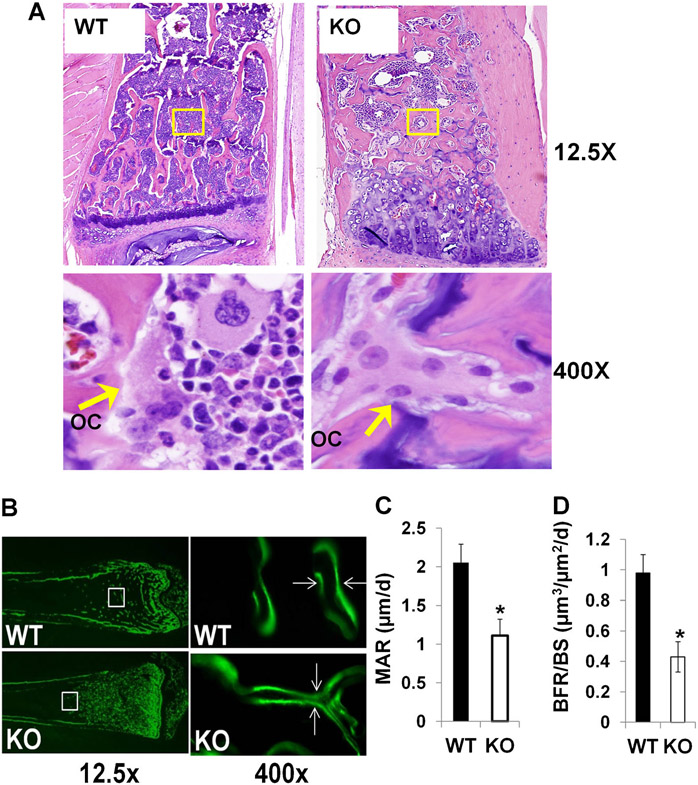
Fig. 4.
Reduced bone resorption and bone formation rate in Lrrk1 KO mice. (A) Longitudinal bone sections of L5 of 79-week-old male mice. Bone sections are stained with hematoxylin and eosin. Arrows indicate osteoclasts (OCs) within the areas indicated. (B) Images of calcein double-labeling of the femurs from 8-week-old mice. Mineral apposition rate (MAR) (C) and bone formation rate (BFR) (D) within the areas indicated. Data are means ± SEM for n = 8. Asterisks indicate a significant difference in KO mice compared with WT mice (p < 0.01).

