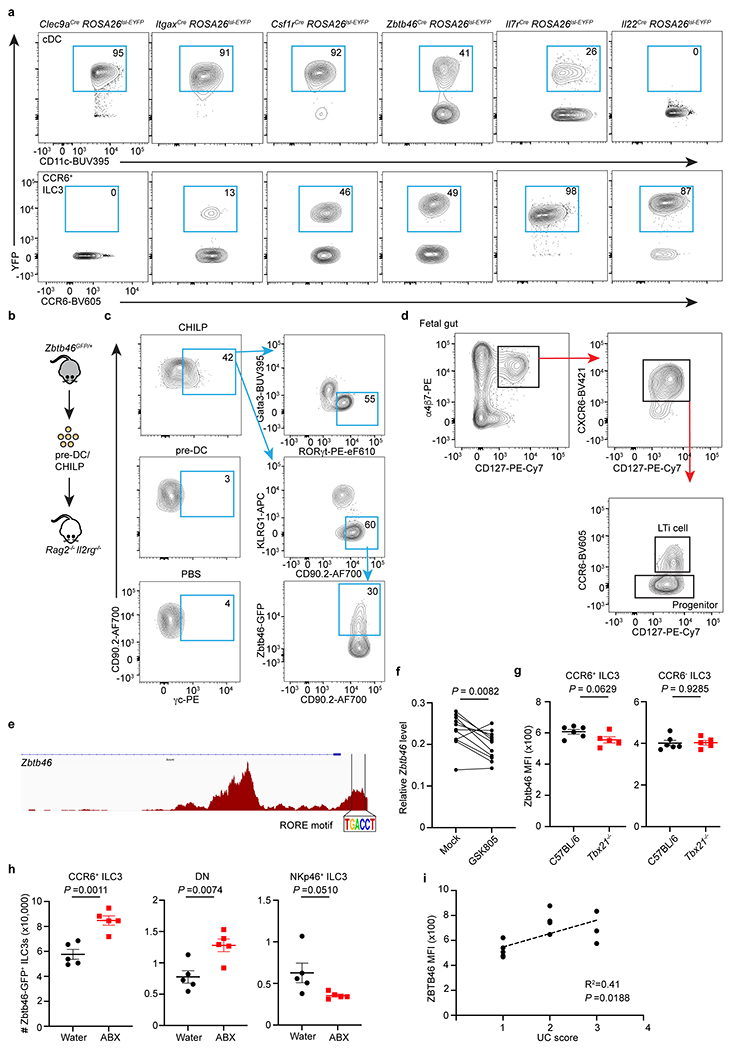
Extended Data Figure 6. Zbtb46+ ILC3s and cDCs are distinct cell lineages.

a. Representative flow cytometry plots showing the YFP+ cells in cDCs and CCR6+ ILC3s from the large intestine of indicated fate-mapping mice. b. Schematic of progenitor cell transfer. pre-DC or CHILP were sort-purified from the bone marrow of Zbtb46GFP/+ and transferred into Rag2−/− Il2rg−/− recipient mice. Six weeks later, ILC3s and Zbtb46-GFP expression were analyzed in the intestine of recipient mice. PBS injection was used as a negative control. pre-DCs were gated as: (Ter119, CD19, B220, CD3, CD5, NK1.1, Ly6G, CD11b)−CD127−MHCII−CD117−CD16/32−CD11c+Flt3+GFP+; CHILP were gated as (Ter119, B220, CD19, NK1.1, CD3, CD5, CD11b, CD11c, Ly6G)−CD45+CD127+α4β7+Flt3−CD25−CD117+. c. Representative flow plots of recipient mice injected with indicated progenitor cells. γc staining was used to differentiate the host-derived and recipient-derived ILCs. d. Gating strategies for progenitors and LTi cells from the fetal tissue. e. RORγt (RORE) motif analysis of the Zbtb46 locus in ATAC-seq data from CCR6+ ILC3s. f. Zbtb46 expression relative to Hprt in sort purified CCR6+ ILC3s with or without exposure to the RORγt inhibitor GSK805 (n = 11 mice). g. Quantification of Zbtb46 MFI in CCR6+ or CCR6− ILC3s from the large intestine of indicated mice (n = 6 or 5 mice per group for both subsets). h. Quantification of cell numbers of Zbtb46-GFP+ cells in indicated ILC3 subsets from the large intestine of water or ABX-treated Zbtb46GFP/+ mice (n = 5 mice for all subsets). i. Correlation analysis of ZBTB46 expression and disease scores in Ulcerative colitis patients. Data are pooled from three or two individual experiments in f and g, data are representative of two independent experiments in h. Data are shown as means ± S.E.M in g and h. Statistics are calculated by two-tailed paired Student’s t-test in f, two-tailed unpaired Student’s t-test in g and h, and the correlation is determined by simple linear regression in i.
