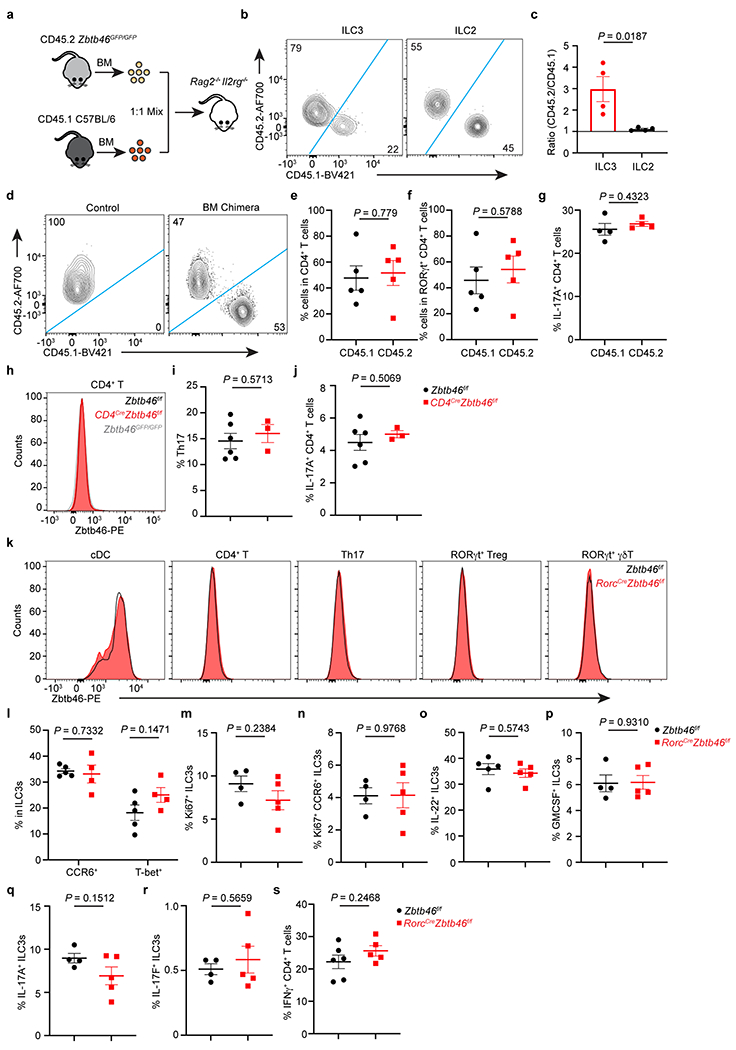
Extended Data Figure 8. Zbtb46 regulates ILC3s in a cell-intrinsic manner.

a. Schematic of mixed bone marrow (BM) chimera. The BM of CD45.2 Zbtb46GFP/GFP and CD45.1 C57BL/6 mice was equally mixed and transferred into Rag2−/−Il2rg−/− recipient mice. Mice were analyzed 6-8 weeks after transplantation. b,c. Representative flow plots of the composition of ILC3s or ILC2s, and quantification of the ratio of CD45.2 to CD45.1 cells in ILC3s or ILC2s in the large intestine of recipient mice (n = 4 mice). d. Representative flow plots of the composition of CD4+ T cells in non-transplanted (control) or BM chimera mice. e. Quantification of the frequencies of indicated CD4+ T cells in the large intestine of BM chimera mice (n = 5 mice). f. Quantification of the frequencies of indicated RORγt+ CD4+ T cells in the large intestine of BM chimera mice (n = 5 mice). g. Quantification of the frequencies of IL-17A+ CD4+ T cells in indicated congenic T cells of BM chimera mice (n = 4 mice). h. Representative flow cytometry histograms of Zbtb46 in CD4+ T cells in the large intestine of indicated mice. i. Quantification of the frequencies of Th17 cells in indicated mice (n = 6 or 3 mice per group). j. Quantification of the frequencies of IL-17A+ CD4+ T cells in indicated mice (n = 6 or 3 mice per group). k-s, Mice were orally infected with C. rodentium for two weeks prior to analysis. k. Representative flow cytometry histograms of Zbtb46 in cDCs and different T cell subsets. l. Quantification of the frequencies of ILC3 subsets in the large intestine of indicated mice (n = 5 or 4 mice per group for both subsets). m,n. Quantification of the frequencies of Ki67+ ILC3 (n = 4 or 5 mice per group) and Ki67+ CCR6+ ILC3s (n = 4 or 5 mice per group) in the large intestine of indicated mice. o-r, Quantification of the frequencies of IL-22+ (n = 5 mice per group), GMCSF+ (n = 4 or 5 mice per group), IL-17A+ (n = 4 or 5 mice per group), and IL-17F+ (n = 4 or 5 mice per group) ILC3s in the large intestine of indicated mice. s. Quantification of the frequencies of IFNγ+ CD4+ T cells in the large intestine of indicated mice (n = 6 or 5 mice per group). Data are representative of two or three independent experiments in b-s. Data are shown as the means ± S.E.M. Statistics are calculated by two-tailed unpaired Student’s t-test.
