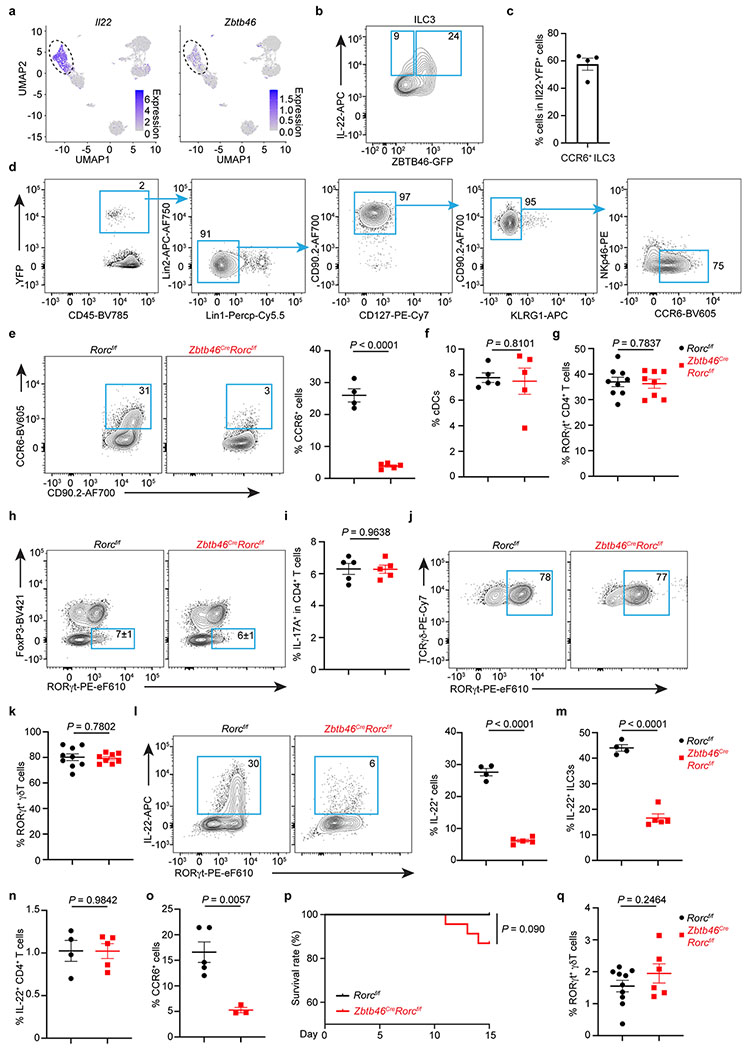
Extended Data Figure 9. Zbtb46+ ILC3s are a dominant source of tissue protective IL-22.

a. UMAPs show the expression of Il22 or Zbtb46 in all clusters of RORγt+ immune cells from the large intestine of RORγtEGFP mice. The dash circle indicates IL-22+ ILC3s. b. Representative flow plot of IL-22 and Zbtb46 expression in the large intestine of Zbtb46GFP/+ mice. c. Quantification of CCR6+ ILC3s in total Il22-YFP+ cells from the large intestine of Il22CreROSA26lsl-YFP mice (n = 4 mice). d. Representative flow plots presenting unbiased gating for Il22-YFP+ cells in the large intestine of Il22CreROSA26lsl-EYFP fate-mapping mice. Lineage 1: CD3, CD5, NK1.1, TCRγδ, Ly6G. Lineage 2: F4/80 and B220. e. Representative flow plots and quantification of CCR6+ cells in the large intestine of indicated mice. Cells were gated from Lineage−CD90.2+CD127+ cells (n = 4 or 5 mice per group). f. Quantification of the frequencies of cDCs in the large intestine of indicated mice (n = 5 mice per group). g. Quantification of the frequencies of RORγt+ CD4+ T Cells in the large intestine of indicated mice (n = 9 or 8 mice per group). h, i. Representative flow plots and quantification of Th17 or IL-17A+ CD4+ T cells in the large intestine of indicated mice (n = 5 mice per group). j,k. Representative flow plots and quantification of the frequencies of RORγt+ γδ T cells in the large intestine of indicated mice (n = 9 or 8 mice per group). l. Representative flow plots and quantification of the frequencies of IL-22+ cells in the large intestine of indicated mice (n = 4 or 5 mice per group). Cells were gated from Lineage−CD90.2+CD127+ cells. m. Quantification of the frequencies IL-22+ ILC3s in the large intestine of indicated mice (n = 4 or 5 mice per group). Cells were gated from Lineage−CD90.2+CD127+RORγt+ ILC3s. n. Quantification of the frequencies IL-22+ CD4+ T cells in the large intestine of indicated mice (n = 4 or 5 mice per group). o-q. Mice were orally infected with C. rodentium for two weeks prior to analysis. o. Quantification of the frequencies of CCR6+ ILCs in the large intestine of indicated mice (n = 5 or 3 mice per group). Cells were gated from Lineage−CD90.2+CD127+ cells. p. Quantification of survival rate of indicated mice following C. rodentium infection (n = 21 or 23 mice per group). q. Quantification of the frequencies of RORγt+ γδ T cells out of total CD45+ cells in the large intestine of indicated mice (n = 10 or 6 mice per group). Data are representative of two independent experiments in b-d, and three independent experiments in e,f, h, i, l-o. Data are pooled from two independent experiments in g, k, and q. Data are pooled from four independent experiments in p. Data are shown as the means ± S.E.M. in c, e, f, g, i, k-o, q, and means ± S.D. in h. Statistics are calculated by two-tailed unpaired Student’s t-test in e-g, i, k-o, q, and by Log-rank (Mantel-Cox) test in p.
