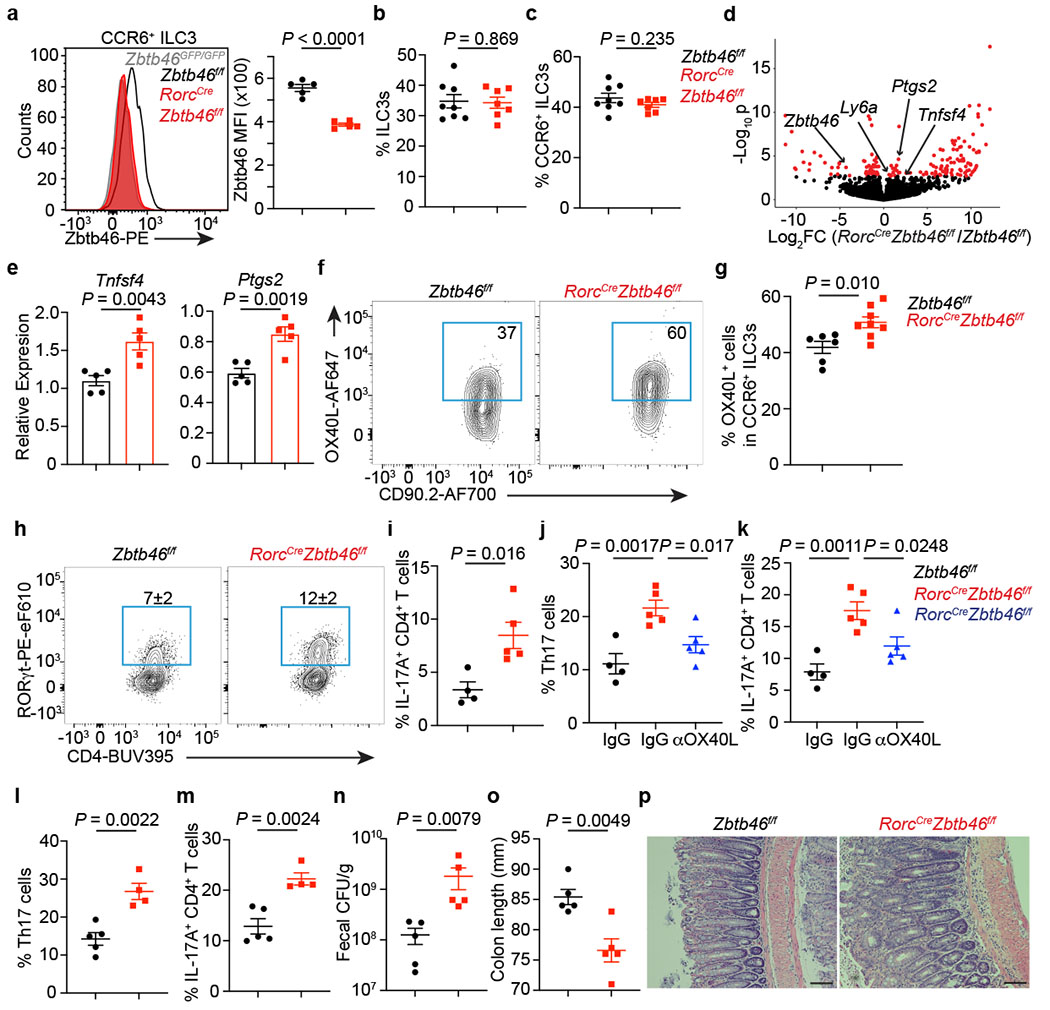
Figure 3. Zbtb46 restrains ILC3s and limits intestinal inflammation.

a. Quantification of Zbtb46 MFI among cells (n = 5 mice). b. Frequency of ILC3s among Lin−CD90+CD127+ cells (n = 8 or 7 mice). c. Quantification of CCR6+ ILC3s (n = 8 or 7 mice). d. Differential gene expression in CCR6+ ILC3s. Red points are significantly different. e. qPCR of indicated genes (n = 5 mice). f,g. Quantification of OX40L+CCR6+ ILC3s (n = 6 or 8 mice). h. Quantification of Th17 cells gated on FoxP3−CD4+ T cells (n = 4 or 5 mice). i. Quantification of IL-17A+CD4+ T cells (n = 4 or 5 mice). j. Quantification of Th17 cells (n = 4, 5, or 5 mice). k. Quantification of IL-17A+CD4+ T cells (n = 4, 5, or 5 mice). l-p. Mice were orally infected with C. rodentium. l. Quantification of Th17 cells at day 13 post infection (dpi) gated on FoxP3−CD4+ T cells (n = 5 or 4 mice). m. Quantification of IL-17A+CD4+ T cells from infected mice (n = 5 or 4 mice). n. Quantification of fecal colony-forming units (CFU) at 8 dpi (n = 5 mice). o. Colon length (n = 5 mice) at 13 dpi. p. H&E staining of the distal colon at 13 dpi. All data are on cells isolated from the large intestine unless otherwise noted. Data in a, e, h, i, j, k, l-p are representative of 3 or 4 independent experiments. Data are pooled from two independent experiments in b, c, and g. Data are shown as the means ± S.E.M in a-c, e, g, i-o, and means ± S.D. in h. Statistics are calculated by two-tailed unpaired Student’s t-test in a-c, e, g, i, l-o; one-way ANOVA with Dunnett’s multiple comparisons in j and k. Scale bar: 100 μm.
