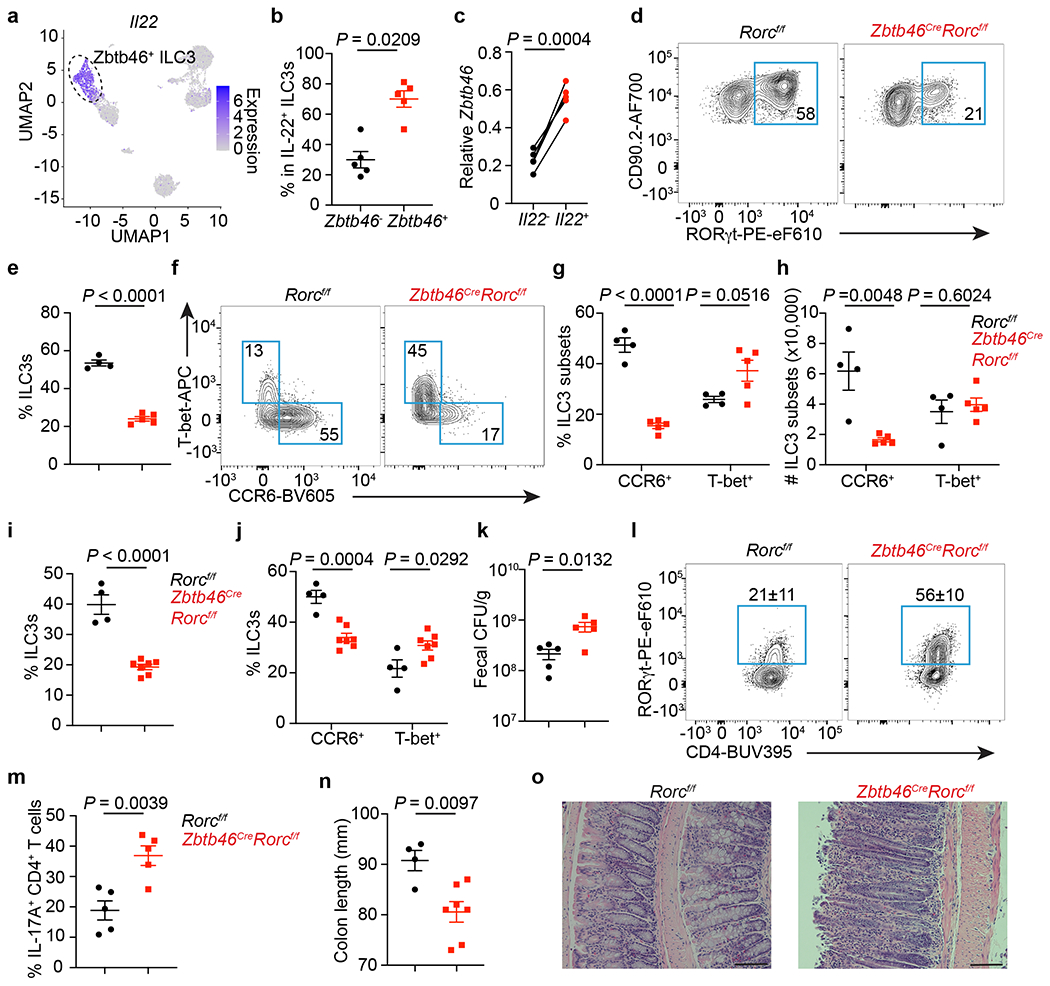
Figure 4. Zbtb46+ ILC3s are non-redundant in controlling intestinal inflammation.

a. UMAP of Il22 expression among RORγt+ immune cells from the large intestine. Dash circle indicates Zbtb46+ ILC3s. b. Quantification of IL-22+ cells among Zbtb46+ versus Zbtb46− ILC3s (n = 5 mice). c. Zbtb46 mRNA relative to Hprt in ILC3s sorted from the large intestine of Il22-eGFP reporter mice (n = 5 mice). d,e. Flow plots and the frequency of ILC3s in Lin−CD90+CD127+ cells from the large intestine (n = 4 or 5 mice). f,g. Flow plots and quantification of ILC3 subsets in the large intestine (n = 4 or 5 mice). h, Cell numbers of ILC3 subsets in the large intestine (n = 4 or 5 mice). i-o. Mice were orally infected with C. rodentium. i. The frequency of ILC3s in Lin−CD90+CD127+ cells from the large intestine at 14 dpi (n = 4 or 7 mice). j. Quantification of ILC3 subsets in the large intestine at 14 dpi (n = 4 or 7 mice). k. Fecal CFU at 10 dpi (n = 5 mice). l. Flow plots and quantification of Th17 cells gated on FoxP3−CD4+ T cells from the large intestine at 14 dpi (n = 5 mice). m. Quantification of IL-17A+ cells in CD4+ T cells from the large intestine at 14 dpi (n = 5 mice). n. Colon length at 14 dpi (n = 4 or 7 mice). o. H&E staining of the distal colon at 14 dpi. Data in b-n are representative of two or three independent experiments. Data are shown as the means ± S.E.M in b, c, e, g-k, m, n, and means ± S.D. in l. Statistics are calculated by two-tailed unpaired Student’s t-test in b, e, g-k, m, n, and two-tailed paired t-test in c. Scale bar: 100 μm.
