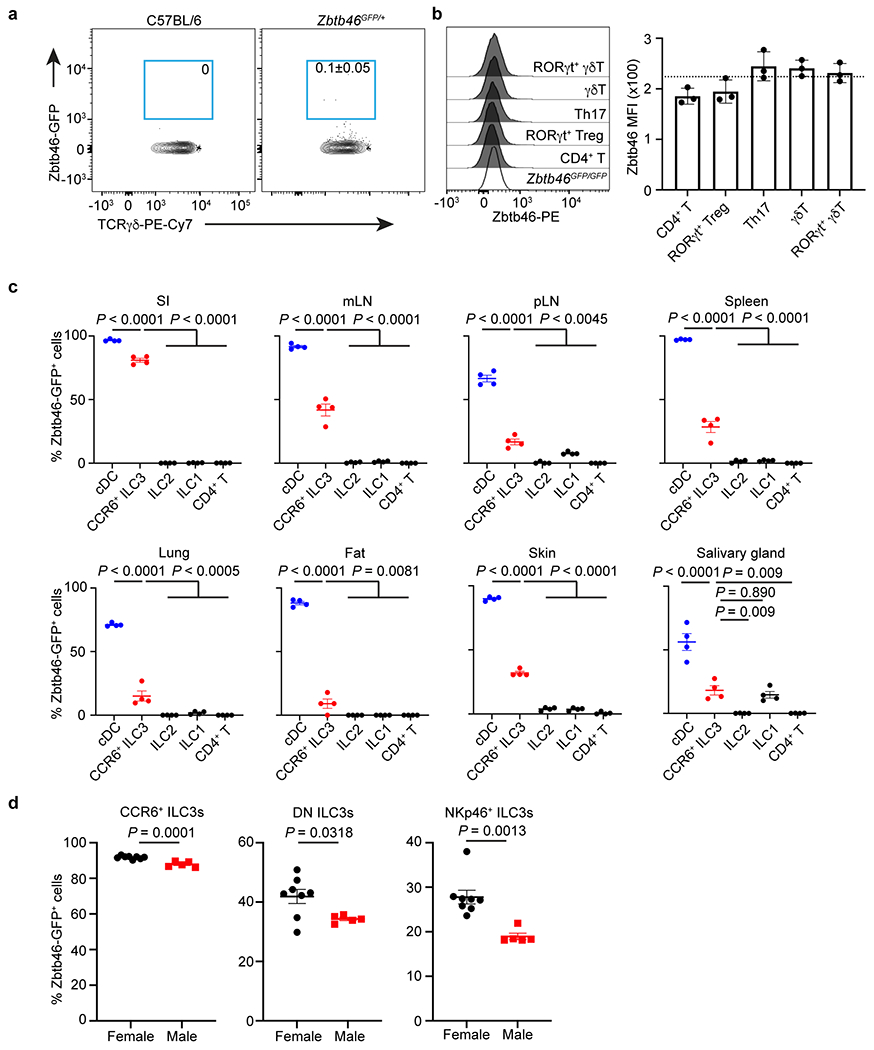
Extended Data Figure 4. Zbtb46 is expressed by ILC3s in mucosal and lymphoid tissues.

a. Representative flow plots of Zbtb46-GFP+ cells in γδT cells in the large intestine of C57BL/6 or Zbtb46GFP/+ mice (n = 4 mice). b. Representative flow cytometry histogram and quantification of Zbtb46 MFI in indicated T cell subsets from the large intestine of C57BL/6 or Zbtb46GFP/GFP mice (n = 3 mice). The dash line indicates Zbtb46 MFI in CD4+ T cells from Zbtb46GFP/GFP. c. Quantification of Zbtb46-GFP+ cell frequencies of indicated cells in the small intestine (SI), mesenteric lymph nodes (mLN), periphery lymph nodes (pLN), Spleen, Lung, Fat, Skin, and salivary gland of Zbtb46GFP/+ mice (n = 4 mice for all tissues). d. Quantification of Zbtb46-GFP+ cell frequencies of ILC3 subsets in the large intestine of Zbtb46GFP/+ female or male mice (n = 8 or 5 mice per group for all subsets). Data are representative of two independent experiments a-c, and data are pooled from 2 individual experiments in d. Data are shown as the means ± S.E.M. in b-d, means ± S.D. in a. Statistics are calculated by One-way ANOVA with Dunnett’s multiple comparisons in c and by two-tailed unpaired Student’s t-test in d.
