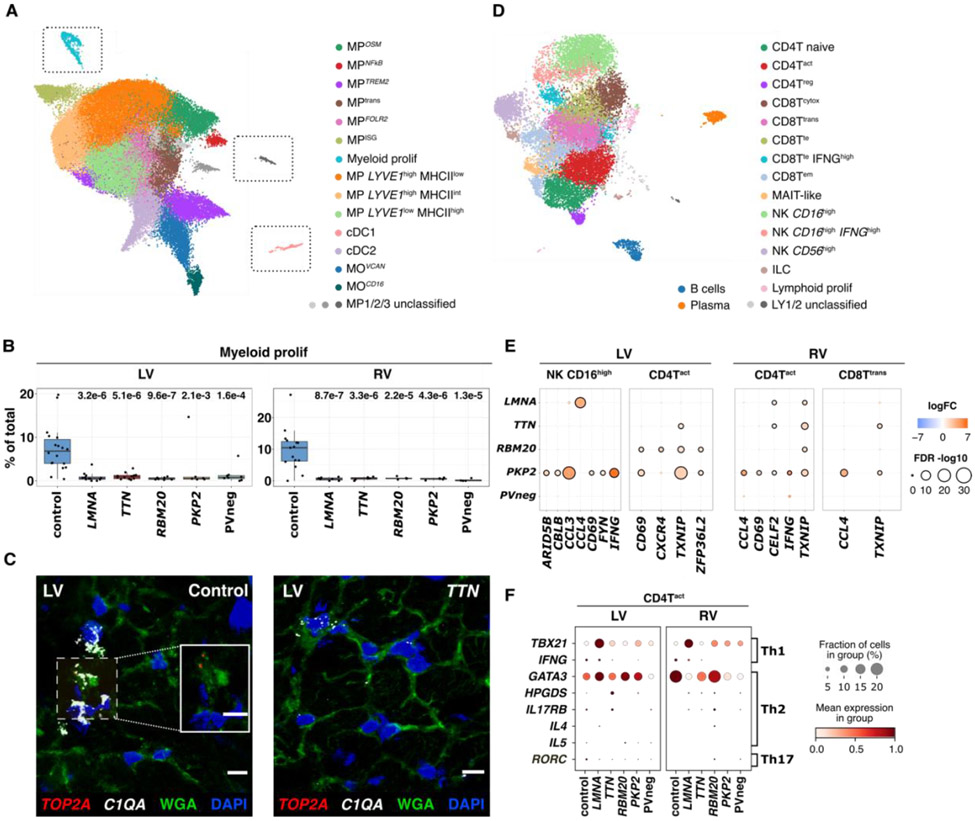
Figure 4: Immune cell states in control, DCM, and ACM hearts.
(A) UMAP depicting myeloid states in all tissues. Unclassified MP1, 2, and 3 require future characterization. Gray boxes enclosing proliferating (prolif) MPs, unclassified MPs, and cDC1s indicate that these were manually juxtaposed toward other states for ease of representation. The unmodified UMAP is in Fig. S23. (B) Myeloid prolif have higher abundance (% total myeloids) in controls versus disease. p-values indicate significant differences in abundances. (C) Single-molecule RNA fluorescent in situ hybridization validated increased expression of TOP2A (red) and C1QA (white) in controls versus disease. Cell boundaries, WGA-stained (green); Nuclei DAPI-stained (blue); Bar 10μm. (D) UMAP depicting lymphoid cell states in all tissues. Unclassified LY1 and 2 require future characterization. (E) Dot plots show the level of fold-change (logFC) and significance (−log10(FDR)) of selected genes in LV NK CD16hi, LV and RV CD4Tact, and RV CD8Ttrans across genotypes. (F) Dot plots highlight gene expression levels of the Th1, 2 and 17 signatures in CD4Tact cells. Dot size, fraction (%) of expressing cells; color, mean expression level.

