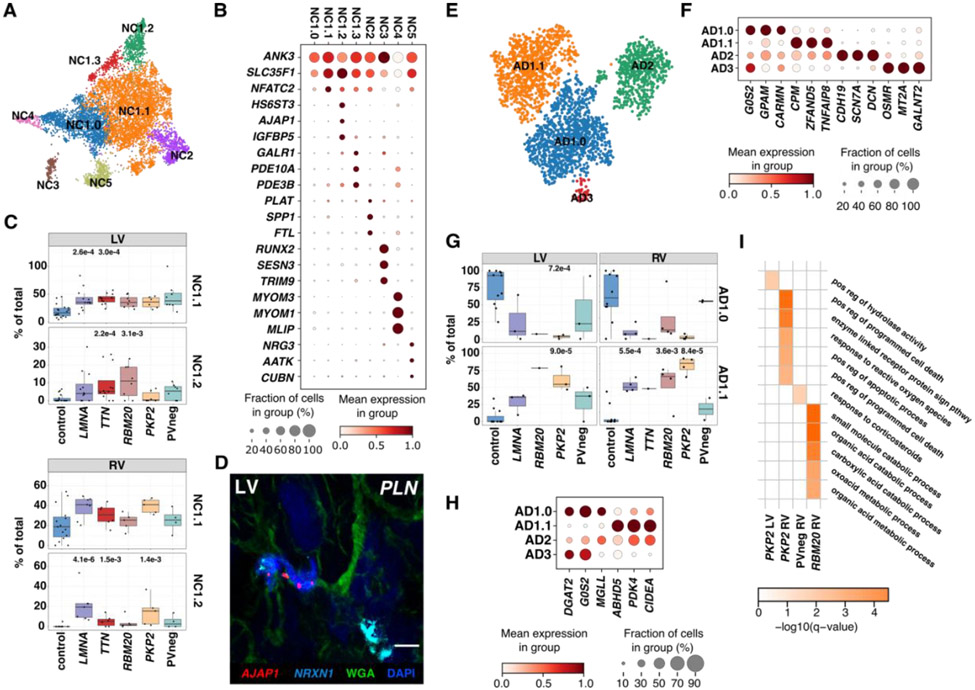
Figure 5: Neuronal and Adipocyte cell states in control, DCM, and ACM hearts.
(A) UMAP depicting NC states in all tissues. (B) Dot plot highlights top marker genes for NC states. (C) LV and RV abundance analyses of NC1.1 and 1.2 in controls versus disease. p-values are indicated for significant proportional changes, FDR≤0.05. (D) Single-molecule RNA fluorescent in situ hybridization shows colocalization AJAP1 (red), and NRXN1 (cyan) in disease (exemplified in a DCM LV with a PV in PLN (phospholamban), demarcating the NC1.2 state. Cell boundaries, WGA-stained (green); Nuclei DAPI-stained (blue), Bar 10μm. (E) UMAP depicting AD states in all tissues. (F) Dot plot highlights top marker genes for AD states. (G) LVs and RVs abundance analyses demonstrate decreased AD1.0 and increased AD1.1 in disease versus control. (H) Dot plot of DEGs shows expression differences between AD states. (I) Heatmap of significantly enriched Gene Ontology Biological Processes terms based on significantly upregulated genes in diseased versus control ADs. Dot plots: Dot size, fraction (%) of expressing cells; color, mean expression level. p-values indicate significant differences; FDR≤0.05.

