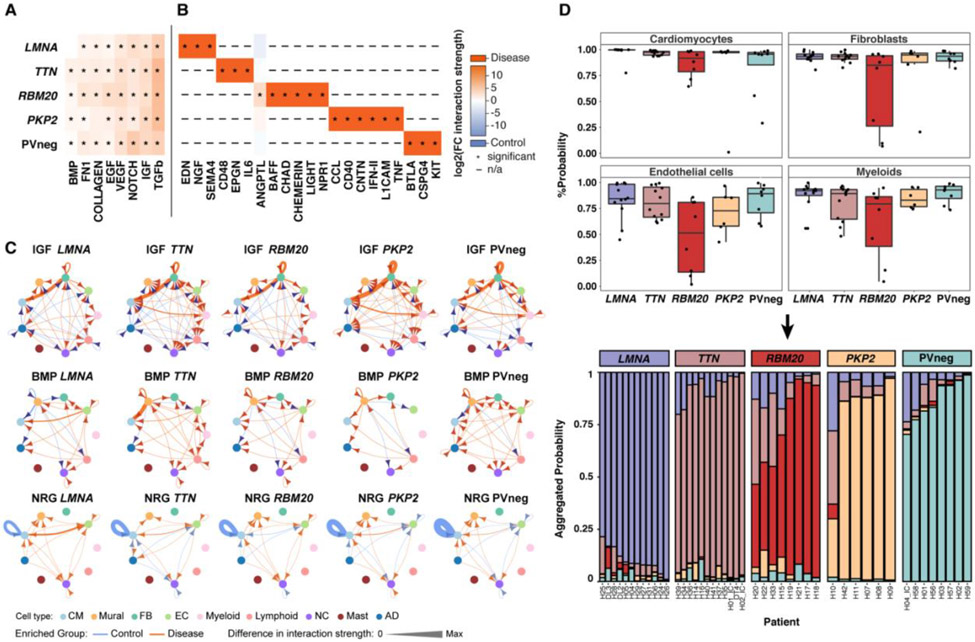
Figure 6: Altered cell-cell interactions and recognition of genotype-specific transcriptional responses.
Heatmaps depict shared (A) and unique (B) signaling pathways in LVs, with significantly different expression in genotypes compared to controls. Signaling pathways are defined in the CellChat database (75). Changes in interaction strength (log2(fold-change)), scaled by color intensity (red, increased; blue, decreased). *denotes significance; adjusted p-values≤0.05; n/a denotes expression not detected in control or disease. (C) Circle plots of significant (adjusted p-value≤0.05) cell-cell communication depict differentially regulated IGF, BMP, and NRG pathways and interactions in disease LVs. The line thickness denotes interaction strength of signals from sending and receiving cell; with color scaled from zero to maximum in disease versus controls (orange, increased; blue, decreased). Arrows indicate directionality. (D) (Top) Genotype prediction probability from graph attention networks (GAT) per cell type. (Bottom) Stacked bar plots represent the likelihood (% aggregated probability) of individual patient genotypes by GAT prediction. The vast majority of established genotypes were predicted with high probability, with lower prediction probability only in H10 (PKP2), H20 (RBM20), H22 (RBM20) and H33 (RBM20).

