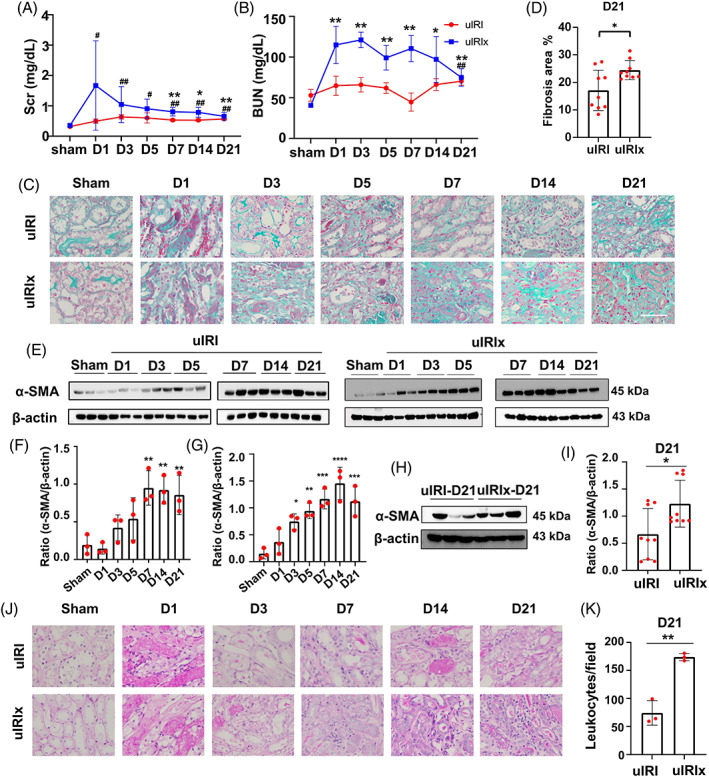
FIGURE 1.

The renal function and pathological characteristics of uIRIx and uIRI models. (A, B) The levels of Scr and Bun in mice in the uIRIx and uIRI models were measured by ELISA. (C, D) Masson staining of uIRIx and uIRI samples at different time points after reperfusion; the percentage of the fibrotic area was quantified. (E–G) Expression of α‐SMA in the kidney after reperfusion detected by western blotting in uIRI and uIRIx mice. (H, I) Expression of α‐SMA in the kidney at D21 after reperfusion detected by western blotting in uIRIx and uIRI mice. (J, K) PAS staining of uIRIx and uIRI samples at different time points after reperfusion; the number of infiltrated leukocytes/field was quantified. Data are presented as the mean ± SD, n = 3–9. *p < 0.05, **p < 0.01. Scale bar = 50 μm. α‐SMA, α‐smooth muscle actin; Bun, blood urea nitrogen; PAS, Periodic acid–Schiff; Scr, serum creatinine; uIRI, unilateral ischemia–reperfusion injury model group; uIRIx, unilateral ischemia–reperfusion injury and contralateral nephrectomy
