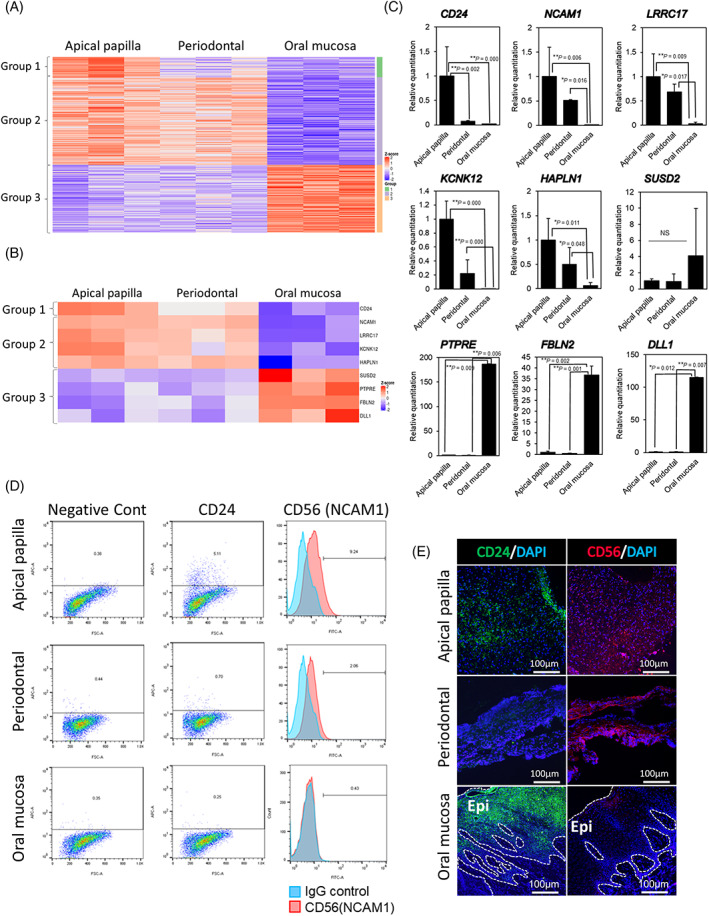
FIGURE 4.

Differences in transcriptome and expression of cell surface proteins among sphere‐forming APDCs, PDLDCs, and OMSDCs. (A) Heatmap of significant differences in the transcriptome and expression among sphere‐forming APDCs, PDLDCs, and OMSDCs. Cutoff line: Fold change >2.0 and adjusted p < 0.05 (n = 3, patient‐matched). (B) Common differentially expressed genes identified using microarray analysis. (C) Quantitative RT‐PCR analysis showing differences in the expression levels of genes selected using microarray analysis in APDCs, PDLDCs, and OMSDCs (n = 4, patient‐matched). (D) Flow cytometric analyses of differentially expressed CD24 and CD56 (NCAM1). (E) Immunohistochemical analyses of differentially expressed CD24 and CD56 (NCAM1) in human oral tissues. Abbreviations: DAPI, 4′,6‐diamidino‐2‐phenylindole. *p < 0.05, **p < 0.01
