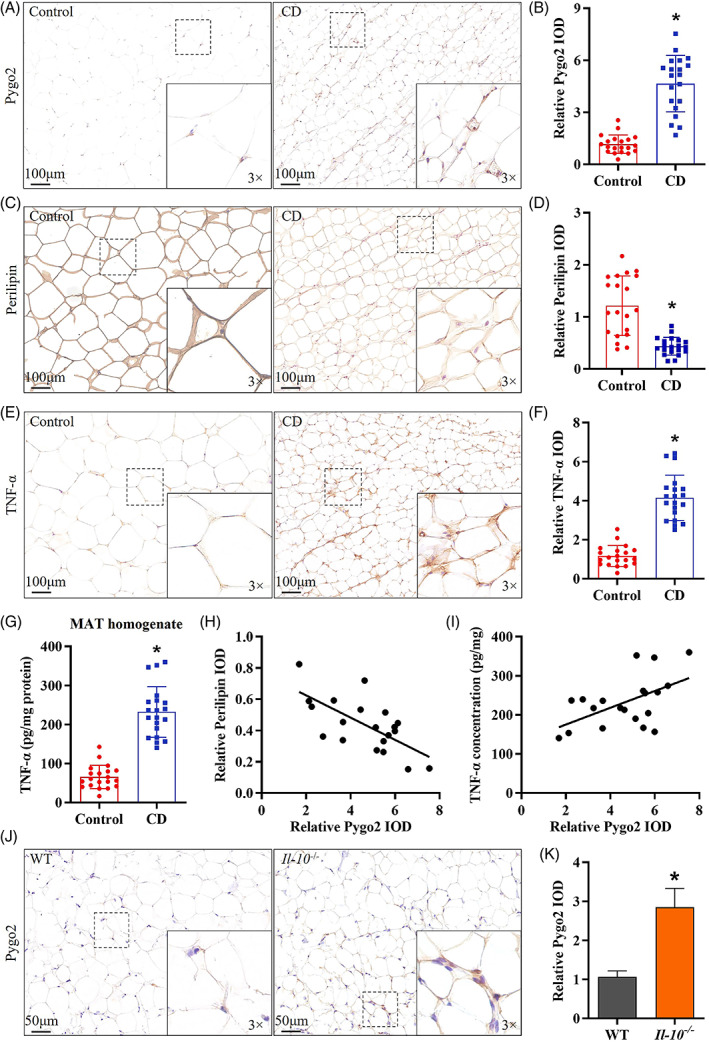
FIGURE 1.

Increased Pygo2 in the MAT of CD patients and Il‐10 −/− mice. Representative image and quantitative analysis of Pygo2 (A‐B), Perilipin (C‐D), and TNF‐α (E‐F) expression in the MAT of control patients and CD patients, as shown by immunohistochemical staining (both n = 20). ELISA analysis of TNF‐α in the MAT homogenate of control patients and CD patients (G). Correlation analysis of the relative protein expression of Pygo2, Perilipin (H) and TNF‐α (I) in CD patients. Immunohistochemical staining (J) and quantitative analysis (K) of Pygo2 in the MAT of Il‐10 −/− mice and WT mice. The dot plots are representative of 8 independent animals. Pygo2, Pygopus2; MAT, mesenteric adipose tissue; CD, Crohn's disease; WT, wild‐type; IOD, integrated optical density; Il‐10 −/− , Il‐10 deficient. The data are presented as the mean ± SD. *p < 0.05
