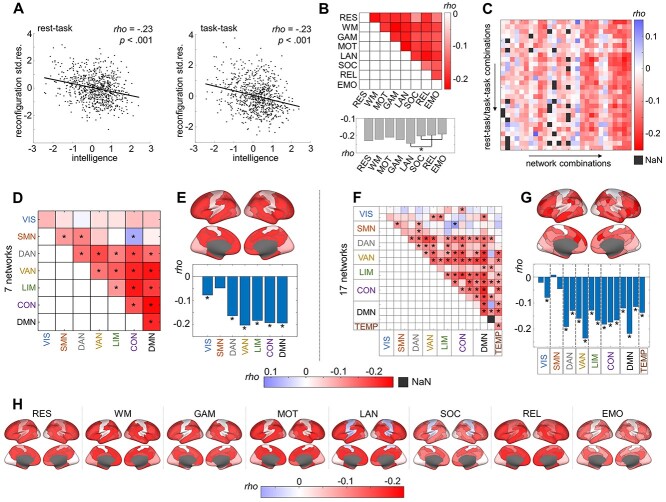
Figure 2.
Less brain network reconfiguration is associated with higher intelligence. All associations were operationalized as partial Spearman correlation (rho) between intelligence (g-factor derived from 12 cognitive tasks) and brain network reconfiguration (cosine distance between FC matrices of different states) controlled for influences of age, sex, handedness, and in-scanner head motion. Correlation strengths are depicted in different colors. Brain networks were derived from the Yeo atlas (Yeo et al. 2011) and network-specific correlations were projected onto the surface of the brain. (A) Scatterplots illustrate the association between intelligence (x-axis) and the standardized residuals resulting from linear regression of age, sex, handedness, and in-scanner head motion on brain network reconfiguration averaged over all possible rest-task combinations (y-axis, left panel), and all possible task-task combinations (y-axis, right panel), respectively. Note that only in this subfigure data of one subject was excluded due to visualization purposes. (B) Upper panel: Association between intelligence and brain network reconfiguration for all possible state combinations (all correlations are significant). Lower panel: Associations between intelligence and a total measure of state-specific reconfiguration, that is, reconfiguration values were averaged over all state combinations that the respective state was involved in. Note that for task states, only combinations with different tasks (no rest) were included. (C) Associations between intelligence and brain network- and state combination-specific reconfiguration values. Network combinations refer to all within and between network connectivity combinations (columns). Note that NaN (not a number) values exist if in a specific network-state combination, no single brain connection passes the filtering procedure (see Supplementary Fig. 1 and Materials and Methods). For details about the assignment of the correlation values to the specific state and network combinations, see Supplementary Figure 7. (D–G) Brain network-specific associations between general intelligence and brain network reconfiguration (significant correlations (FDR-corrected P-values, α = 0.05) are marked with asterisks). Associations between intelligence and brain network-specific reconfiguration values for seven (D) and 17 (F) separate brain networks. Reconfiguration scores averaged across all within- and between network combinations a respective network is involved in resulted in total association values for seven (E) and 17 (G) brain networks. (H) Associations between intelligence and brain network reconfiguration for each cognitive state. Reconfiguration values were averaged over all state combinations a respective state was involved in, and averaged over all network combinations (within- and between network connectivity of seven brain networks) the respective network was involved in. Std. res., standardized residuals; FDR, false discovery rate; RES, resting state; WM, working memory task; GAM, gambling task; MOT, motor task; LAN, language processing task; SOC, social cognition task; REL, relational processing task; EMO, emotion processing task. VIS, visual network; SMN, somatomotor network; DAN, dorsal attention network; VAN, salience/ventral attention network; LIM, limbic network; CON, control network; DMN, default mode network; TEMP, temporal parietal network.

