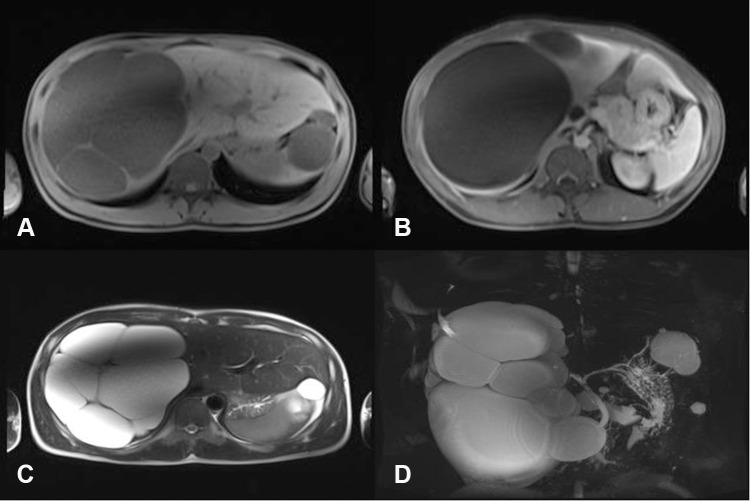
Figure 3.
Magnetic resonance image. (A) Axial section showing multiple liver cysts with low signal on T1-weighted sequence. (B) Axial section showing multiple liver cysts with low signal on the T1-weighted sequence, without enhancement after infusion of paramagnetic contrast in the portal phase. (C) Axial section showing multiple liver cysts with high signal on T2-weighted sequence. (D) Coronal section, 2D multiplanar reconstruction, in T2 sequence.

