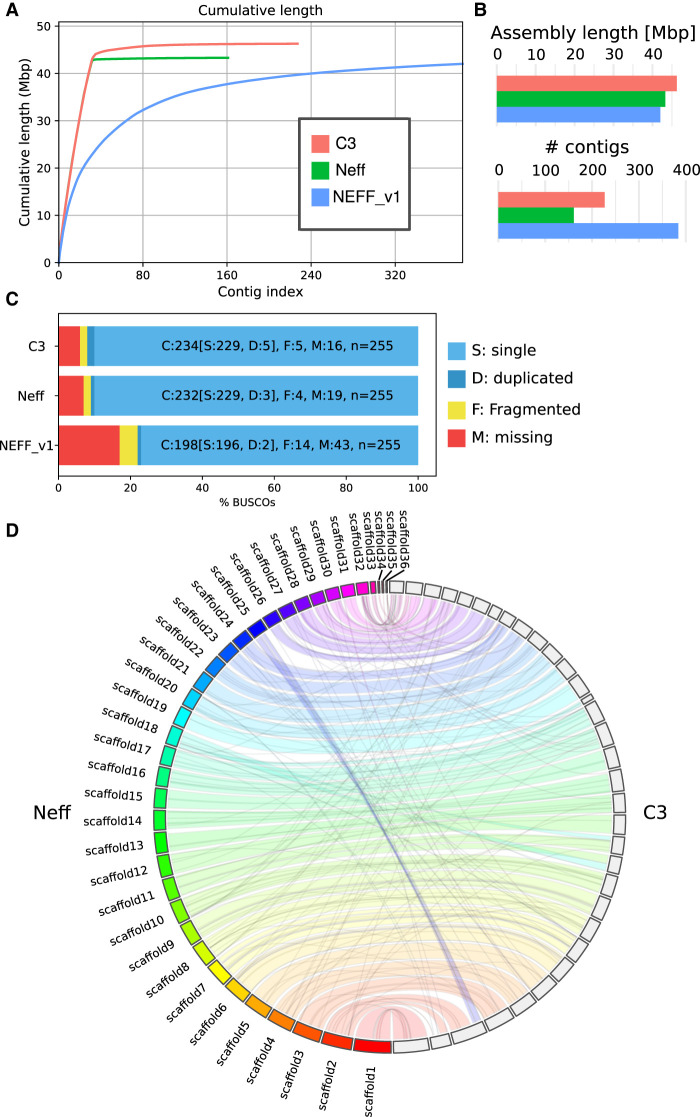
Figure 1.
Assembly statistics for A. castellanii genomes. Comparison of genome assemblies for strains C3 and Neff-v2 versus the previous Neff-v1 genome assembly (Clarke et al. 2013). (A) Cumulative length plot showing the relationship between the number of contigs (largest to smallest) and length of the assembly. (B) General continuity metrics. (C) BUSCO statistics showing the status of universal single-copy orthologs in eukaryotes for each assembly. (D) Circos plot showing syntenic blocks for all scaffolds of A. castellanii strains C3 and Neff assemblies >50 kb.

