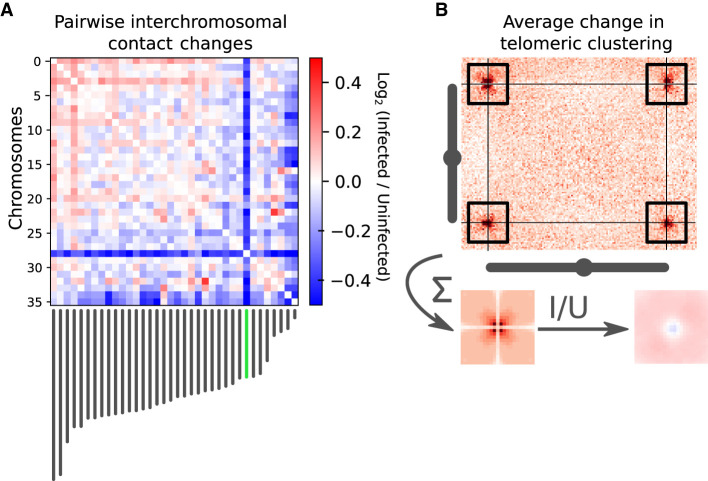
Figure 4.
Changes in trans-chromosomal contacts between A. castellanii chromosomes following L. pneumophila infection. (A) Average contact change during infection between each pair of chromosomes. Chromosome lengths are shown below the interaction matrix, with the chromosome bearing 18S and 28S rDNA highlighted in green. (B) Representative intertelomeric contacts between a pair of chromosomes (C3 scaffolds 3 and 11). The average intertelomeric contact profile generated from all pairs of chromosomes is shown as a pileup. The log ratio between the infected (I) and uninfected (U) profiles is shown as a ratio (right).

