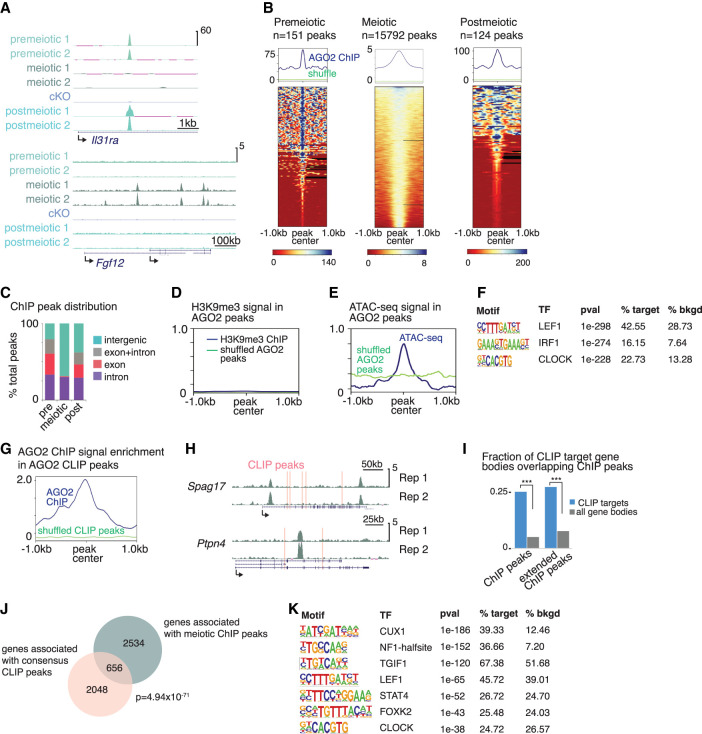
Figure 3.
AGO2 interacts with chromatin and binds the corresponding nuclear transcripts in a developmentally dynamic manner. (A) Genome browser tracks (mm10) showing representative AGO2 ChIP peaks in two replicates from each cell type and from Ago2 cKO mixed meiotic and postmeiotic cells. (B) Enrichment of AGO2 on chromatin in premeiotic, meiotic, and postmeiotic male germ cells. (Top) Metagenes showing average ChIP signal at AGO2 peaks, with reference point set to the peak center. “Shuffle” shows ChIP signal when the same number of length-matched peaks were randomized across the genome. (Bottom) Heatmaps showing ChIP signal enrichment at each peak. (C) Distribution of AGO2 peaks in introns, exons, and intergenic regions. (D) Metagene of H3K9me3 ChIP signal at AGO2 peaks in meiotic cells. (E) Metagene of ATAC-seq signal at AGO2 peaks in meiotic cells. (F) Top motifs enriched in AGO2 ChIP peaks in meiotic cells. (G) AGO2 ChIP enrichment signal at eCLIP peaks in meiotic cells relative to shuffled eCLIP peaks. (H) Genome browser tracks (mm10) showing representative genes associated with both ChIP signal and eCLIP peaks (pink bars). (I) Fraction of meiotic CLIP target genes for which the gene body overlaps a meiotic ChIP peak. “Extended ChIP peaks” represent the same analysis performed with ChIP peaks extended by 10 kb in both directions. (***) P < 10−15, hypergeometric test. (J) Overlap between genes associated with meiotic ChIP peaks and genes containing eCLIP peaks in both meiotic and postmeiotic cells; P-value, hypergeometric test. (K) Motifs enriched in AGO2 ChIP peaks associated with genes that also contain eCLIP peaks. Only motifs matching a transcription factor expressed in meiotic cells are shown.

